


NCERT EXEMPLAR-DATA HANDLING-Exercise
- The following table gives information about the circulation of newspap...
Text Solution
|
- Annual expenditure of a company in the year 2007-2008 is given below: ...
Text Solution
|
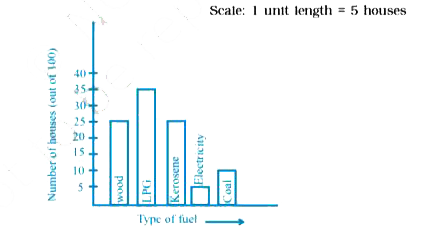
- The following bar graph shows the number of houses (out of 100) in a t...
Text Solution
|
- The following bar graph shows the number of houses (out of 100) in a t...
Text Solution
|
- The following bar graph shows the number of houses (out of 100) in a t...
Text Solution
|
- The following bar graph represents the data for different sizes of sho...
Text Solution
|
- The following bar graph represents the data for different sizes of sho...
Text Solution
|
- The following bar graph represents the data for different sizes of sho...
Text Solution
|
- The following bar graph represents the data for different sizes of sho...
Text Solution
|
- The following bar graph represents the data for different sizes of sho...
Text Solution
|
- The following bar graph represents the data for different sizes of sho...
Text Solution
|
- The following graph gives the information about the number of railway ...
Text Solution
|
- The following graph gives the information about the number of railway ...
Text Solution
|
- The following graph gives the information about the number of railway ...
Text Solution
|
- The following graph gives the information about the number of railway ...
Text Solution
|
- The following graph gives the information about the number of railway ...
Text Solution
|
- The bar graph given below represents approximate length (in kilometres...
Text Solution
|
- The bar graph given below represents approximate length (in kilometres...
Text Solution
|
- The bar graph given below represents approximate length (in kilometres...
Text Solution
|
- The bar graph given below represents approximate length (in kilometres...
Text Solution
|