


Topper's Solved these Questions
Similar Questions
Explore conceptually related problems
NCERT EXEMPLAR-DATA HANDLING-Exercise
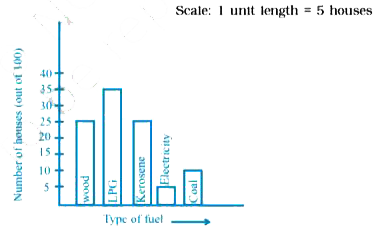
- The following bar graph shows the number of houses (out of 100) in a t...
Text Solution
|
- The following bar graph shows the number of houses (out of 100) in a t...
Text Solution
|
- The following bar graph shows the number of houses (out of 100) in a t...
Text Solution
|
- The following bar graph represents the data for different sizes of sho...
Text Solution
|
- The following bar graph represents the data for different sizes of sho...
Text Solution
|
- The following bar graph represents the data for different sizes of sho...
Text Solution
|
- The following bar graph represents the data for different sizes of sho...
Text Solution
|
- The following bar graph represents the data for different sizes of sho...
Text Solution
|
- The following bar graph represents the data for different sizes of sho...
Text Solution
|
- The following graph gives the information about the number of railway ...
Text Solution
|
- The following graph gives the information about the number of railway ...
Text Solution
|
- The following graph gives the information about the number of railway ...
Text Solution
|
- The following graph gives the information about the number of railway ...
Text Solution
|
- The following graph gives the information about the number of railway ...
Text Solution
|
- The bar graph given below represents approximate length (in kilometres...
Text Solution
|
- The bar graph given below represents approximate length (in kilometres...
Text Solution
|
- The bar graph given below represents approximate length (in kilometres...
Text Solution
|
- The bar graph given below represents approximate length (in kilometres...
Text Solution
|
- The bar graph given below represents the circulation of newspapers in ...
Text Solution
|
- The bar graph given below represents the circulation of newspapers in ...
Text Solution
|