


NCERT EXEMPLAR-DATA HANDLING-Exercise
- The following bar graph represents the data for different sizes of sho...
Text Solution
|
- The following bar graph represents the data for different sizes of sho...
Text Solution
|
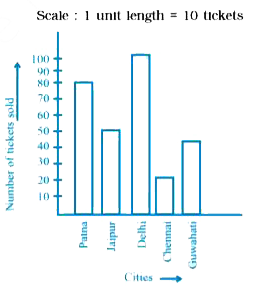
- The following graph gives the information about the number of railway ...
Text Solution
|
- The following graph gives the information about the number of railway ...
Text Solution
|
- The following graph gives the information about the number of railway ...
Text Solution
|
- The following graph gives the information about the number of railway ...
Text Solution
|
- The following graph gives the information about the number of railway ...
Text Solution
|
- The bar graph given below represents approximate length (in kilometres...
Text Solution
|
- The bar graph given below represents approximate length (in kilometres...
Text Solution
|
- The bar graph given below represents approximate length (in kilometres...
Text Solution
|
- The bar graph given below represents approximate length (in kilometres...
Text Solution
|
- The bar graph given below represents the circulation of newspapers in ...
Text Solution
|
- The bar graph given below represents the circulation of newspapers in ...
Text Solution
|
- The bar graph given below represents the circulation of newspapers in ...
Text Solution
|
- Read the bar graph given below and answer the following questions: ...
Text Solution
|
- Read the bar graph given below and answer the following questions: ...
Text Solution
|
- Read the bar graph given below and answer the following questions: ...
Text Solution
|
- Read the bar graph given below and answer the following questions: ...
Text Solution
|
- Read the bar graph given below and answer the following questions: ...
Text Solution
|
- The lengths in km (rounded to nearest hundred) of some major rivers of...
Text Solution
|