Home
Class 6
MATHS
The following table shows the area of th...

The following table shows the area of the land on which different crops were grown.

Prepare a pictograph by choosing a suitable symbol to represent 10 million hectares.

Promotional Banner

Topper's Solved these Questions

  • DATA HANDLING

    NCERT EXEMPLAR|Exercise Exercise (fill in the blanks )|8 Videos
  • ALGEBRA

    NCERT EXEMPLAR|Exercise EXERCISE |104 Videos
  • FRACTIONS AND DECIMALS

    NCERT EXEMPLAR|Exercise ACTIVITY|1 Videos

Similar Questions

Explore conceptually related problems

The following table shows the interest of students of a school in different games : Represent the data by using a simple bar diagram.

The following table shows the percentage of buyers of four different brands of bathing soaps. Represent the above data by a pie chart.

Annual expenditure of a company in the year 2007-2008 is given below: Prepare a pictograph of the above data using an appropriate symbol to represent Rs 10 lakh.

The following table shows the percentage of people having different blood groups. Draw a pie chart to represent the given data. {:("Blood group",A,B,C,D),("Percentage of people",20,45,20,15):}

The following table shows the number of students in different classes of a high school. Draw a histogram to represent the given data. {:("Classes",VI,VII,VIII,IX,X),("Number of students",37,42,35,50,48):}

Total number of students of a school in different years is shown in the following table. Prepare another pictograph of students using any other symbol each representing 50 students. Which pictograph do you find more informative ?

The following pictograph shows the sale of cars of different colours in a showroom. How many less blue cars were sold than red and gray cars together?

The following table gives the areas of the oceans of the word : A pie diagram of this data is to be drawn. What is the angle which the sector representing Pacific Ocean subtends at the centre ?

The following table shows the monthly expenditure of different families on different items : Represent the data in the form of a sub-divided bar diagram.

The following table gives information about the circulation of newspapers (dailies) in a town in five languages. Prepare a pictograph of the above data, using a symbol of your choice, each representing 1000 newspapers.

NCERT EXEMPLAR-DATA HANDLING-Exercise
  1. The bar graph given below represents approximate length (in kilometres...

    Text Solution

    |

  2. The bar graph given below represents approximate length (in kilometres...

    Text Solution

    |

  3. The bar graph given below represents the circulation of newspapers in ...

    Text Solution

    |

  4. The bar graph given below represents the circulation of newspapers in ...

    Text Solution

    |

  5. The bar graph given below represents the circulation of newspapers in ...

    Text Solution

    |

  6. Read the bar graph given below and answer the following questions: ...

    Text Solution

    |

  7. Read the bar graph given below and answer the following questions: ...

    Text Solution

    |

  8. Read the bar graph given below and answer the following questions: ...

    Text Solution

    |

  9. Read the bar graph given below and answer the following questions: ...

    Text Solution

    |

  10. Read the bar graph given below and answer the following questions: ...

    Text Solution

    |

  11. The lengths in km (rounded to nearest hundred) of some major rivers of...

    Text Solution

    |

  12. The number of ATMs of different banks in a city is shown below: D...

    Text Solution

    |

  13. Number of mobile phone users in various age groups in a city is listed...

    Text Solution

    |

  14. The following table represents income of a Gram Panchayat from differe...

    Text Solution

    |

  15. The following table gives the data of number of schools (stage-wise) o...

    Text Solution

    |

  16. Home appliances sold by a shop in one month are given as below: D...

    Text Solution

    |

  17. In a botanical garden, the number of different types of plants are fou...

    Text Solution

    |

  18. In a botanical garden, the number of different types of plants are fou...

    Text Solution

    |

  19. Prepare a bar graph of the data given in question 28.

    Text Solution

    |

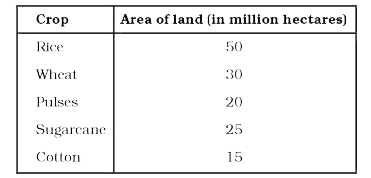
  20. The following table shows the area of the land on which different crop...

    Text Solution

    |