A
B
C
D
Text Solution
Verified by Experts
The correct Answer is:


Topper's Solved these Questions
Similar Questions
Explore conceptually related problems
PHYSICS WALLAH-ELECTROSTATIC POTENTIAL AND CAPACITANCE-NEET Past 5 Years Questions
- In certain region of space with volume 0.2 m^3 the electric potential ...
Text Solution
|
- The capacitance of a parallel plate capacitor with air as Medium is 6 ...
Text Solution
|
- A short electric dipole has dipole moment of 16 x 10^-9 C m. The elect...
Text Solution
|
- The variation of electrostatic potential with radial distance r from c...
Text Solution
|
- A paralel plate capacitor having cross sectional area A and seperation...
Text Solution
|
- The electrostatic force between the metal plate of an isolated paralle...
Text Solution
|
- A capacitor is charged by a battery. The battery is removed and anothe...
Text Solution
|
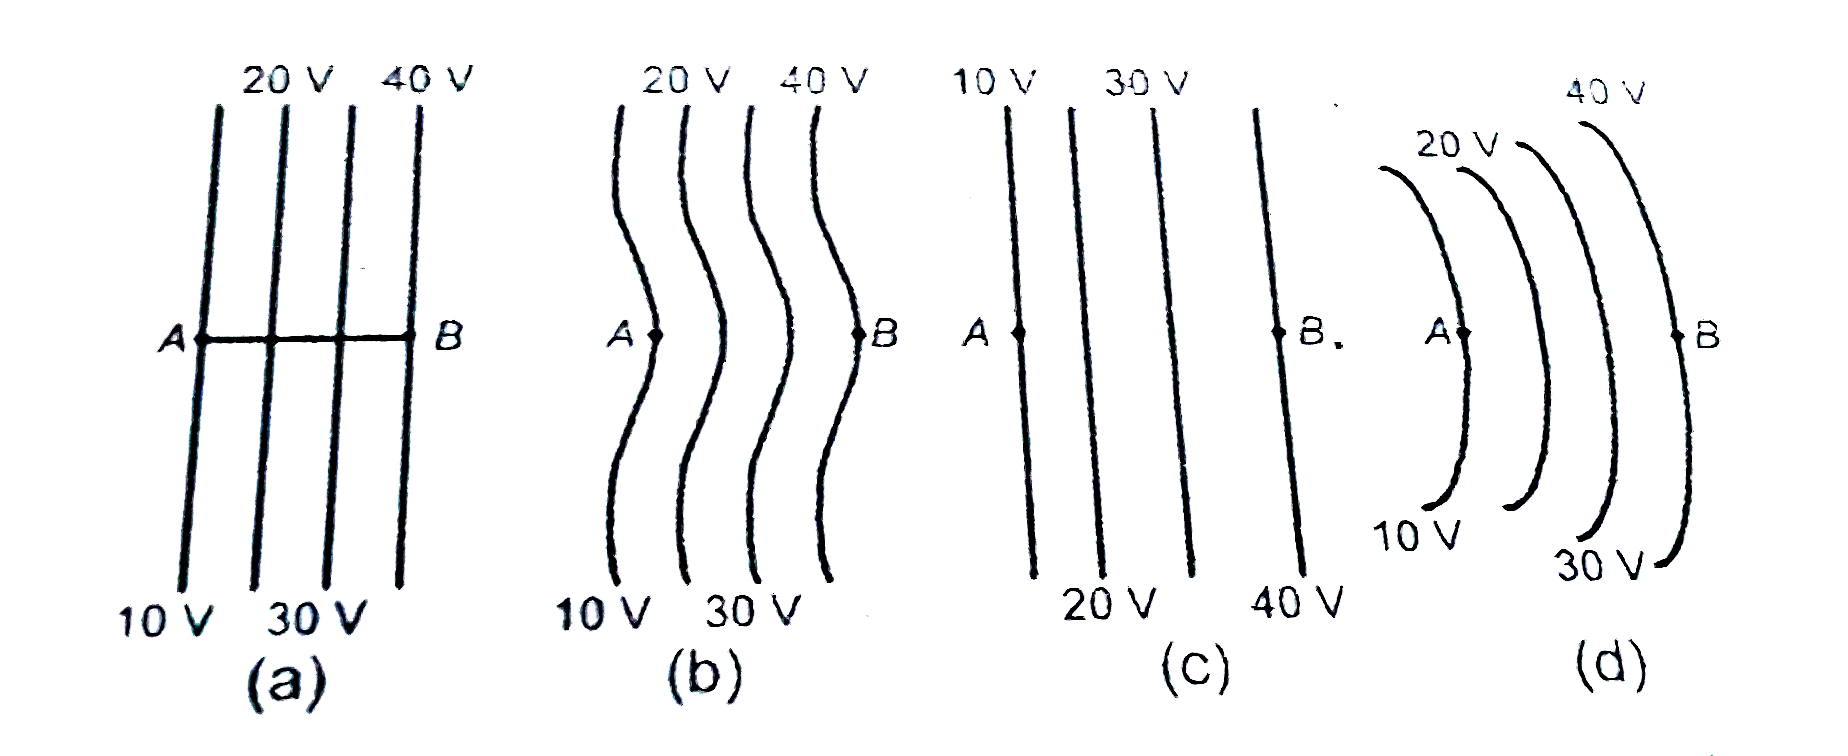
- The diagram below show region of equipotentials. A positive cha...
Text Solution
|
- A molecule of a substance has permanent dipole moment p. A mole of thi...
Text Solution
|
- A wheel having mass m has charges +q and -q on diametrically opposite ...
Text Solution
|
- A parallel -plate capacitor is to be designed, using a dielectric of d...
Text Solution
|
- An electron moves staright inside a charged parallel plate capacitor o...
Text Solution
|
- An electric dipole is placed at an angle of 30^(@) with an electric fi...
Text Solution
|
- A parallel -plate capacitor of area A, plate separation d and capacita...
Text Solution
|
- A capacitor of 2 mu F is charged as shown in the diagram. When the swi...
Text Solution
|