


Similar Questions
Explore conceptually related problems
MBD-COAL AND PETROLEUM-EXAMPLE
- Describe characterstics and uses of coke.
Text Solution
|
- Explain the process of formation of petroleum.
Text Solution
|
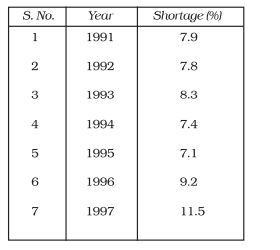
- The following table shows the total power shortage in India from 1991-...
Text Solution
|
- Gurmeet's mother uses cylinder to cook chapatti on gas burner at home....
Text Solution
|
- Monika read in a newspaper that a man became unconscious because of bu...
Text Solution
|
- The example of fossil fuel is :
Text Solution
|
- Which gas is used as fuel in houses ?
Text Solution
|
- The purest form of carbon is :
Text Solution
|
- Which out of the following is the least pollution causing fuel ?
Text Solution
|
- Which is the natural solid fuel?
Text Solution
|
- Which among the following is the best domestic fuel?
Text Solution
|
- Which of the following is the fossil fuel?
Text Solution
|
- Which out of the following is the non renewable source of energy?
Text Solution
|
- Which out of the following is called black gold?
Text Solution
|
- Which out of the following is limited natural resource?
Text Solution
|
- Name some natural materials.
Text Solution
|
- Name some man-made materials.
Text Solution
|
- Define the term fossil fuel. Name three fossil fuels.
Text Solution
|
- How is cake prepared?
Text Solution
|
- Name two products formed as a result of Fractional distillation of pet...
Text Solution
|