


Topper's Solved these Questions
Similar Questions
Explore conceptually related problems
MBD-MODEL TEST PAPER -1 -EXERCISE
- What is the main idea behind "Joint farm management concept" introduce...
Text Solution
|
- List a few transgenic organisms and their potential application.
Text Solution
|
- Draw a lebelled diagram to show interrelationship of four accessory du...
Text Solution
|
- While creation and presence of variations is directionless, natural se...
Text Solution
|
- Large quantity of sewage is generated every day in cities and towns, W...
Text Solution
|
- Large quantity of sewage is generated every day in cities and towns, W...
Text Solution
|
- Large quantity of sewage is generated every day in cities and towns, W...
Text Solution
|
- "Species Bt Toxin gene is incorporated into cotton plant so as to cont...
Text Solution
|
- Given below is a table depicting population interactions between speci...
Text Solution
|
- Indentify the areas labellel as I, ii, iii, and iv in the pie chart gi...
Text Solution
|
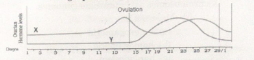
- Study the graph given below related to menstrual cycle in demales: Id...
Text Solution
|
- Study the graph given below related to menstrual cycle in Females: ...
Text Solution
|
- Given below is an enlarged view of one microsporangium of a mature ant...
Text Solution
|
- Given below is an enlarged view of one microsporangium of a mature ant...
Text Solution
|
- Describe Meselson’s and Stahl’s experiment to explain semiconservative...
Text Solution
|
- Describe the structure of a polymer of deoxyribonucleotides.
Text Solution
|
- Name the mode of reproduction that ensures the creation of new variant...
Text Solution
|
- Which of the following represents the female gametophyte in angiosperm...
Text Solution
|
- Give two important contributions of Dr. M. S. Swaminathan .
Text Solution
|
- Suggest two features of plants that will prevent insect and pest infes...
Text Solution
|