


MBD-BIODIVERSITY AND CONSERVATION-EXERCISE
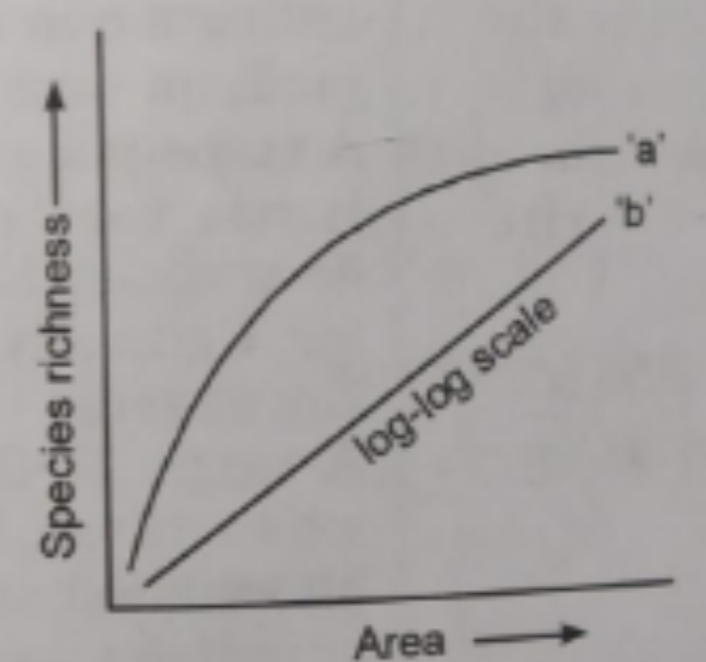
- The following graph shows the species area relationship. Answer the fo...
Text Solution
|
- What is common to the techniques (i) in-vitro fertilisation, (ii) Cryo...
Text Solution
|
- Select the incorrect statement.
Text Solution
|
- Define Biodiversity. Who coined the term Biodiversity?
Text Solution
|
- What does the term frugivorous mean?
Text Solution
|
- Define the terms bioprospecting and endemism.
Text Solution
|
- What is an endangered species? Give an example of an endangered plant ...
Text Solution
|
- Differentiate in situ and ex-situ conservation.
Text Solution
|
- What is a hot spot?
Text Solution
|
- Write a critical note on genetic diversity.
Text Solution
|
- Explain various zones of biosphere reserves and write significance of ...
Text Solution
|
- Explain biodiversity as sources of food and improved varieties.
Text Solution
|
- What are the causes of loss of biodiversity?
Text Solution
|
- What are sacred groves ? What is their role in conservation?
Text Solution
|
- Describe the efforts made for conservation of biodiversity in India.
Text Solution
|