


Topper's Solved these Questions
Similar Questions
Explore conceptually related problems
MBD-ENVIRONMENT ISSUES-EXERCISE
- What are major causes of species losses in a geographical area ?
Text Solution
|
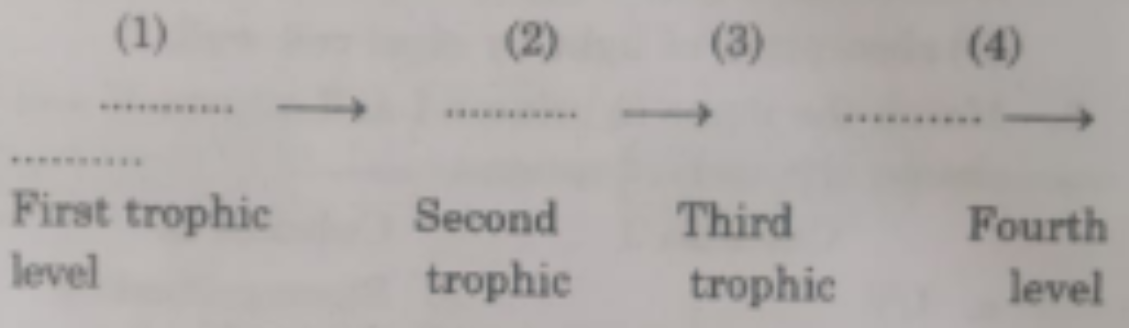
- A diagrammatic representation of different trophic levels in an ecosys...
Text Solution
|
- A diagrammatic representation of different trophic levels in an ecosys...
Text Solution
|
- A diagrammatic representation of different trophic levels in an ecosys...
Text Solution
|
- What is eutrophication? Differentiate between natural and accelerated ...
Text Solution
|
- When and where was Earth Summit held?
Text Solution
|
- What is Kyoto protocol?
Text Solution
|
- Name the biggest source of air pollution in large cities.
Text Solution
|
- Explain : Biological magnification
Text Solution
|
- List the uses of biodiversity.
Text Solution
|
- What do A , B and C represent in this graph with respect to organismic...
Text Solution
|
- Differentiate between EI-nino and La-nina effect.
Text Solution
|
- "To reduce or check the global warming is the biggest challenge. Scien...
Text Solution
|
- "To reduce or check the global warming is the biggest challenge. Scien...
Text Solution
|
- Four basic processes produce fluctuations in population density Whi...
Text Solution
|
- Four basic processes produce fluctuations in population density Def...
Text Solution
|
- Four basic processes produce fluctuations in population density. defi...
Text Solution
|
- Discuss the causes and effects of water pollution. What measures need ...
Text Solution
|
- What is reforestation?
Text Solution
|
- List the consequences of deforestation.
Text Solution
|