


Topper's Solved these Questions
Similar Questions
Explore conceptually related problems
MBD-DATA HANDLING-EXERCISE
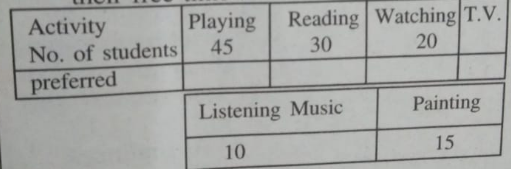
- A survey of 120 school students was done to find which activity they p...
Text Solution
|
- The following data is of the ages(in years) of 20 students of class VI...
Text Solution
|
- Which age group the maximum no. of students belong? 9,10,10,9,9,11,9,...
Text Solution
|
- The heights (in cm) of 30 students of class VIII are given below: 150,...
Text Solution
|
- The yearly savings (in rupees) of 30 students of X are as follow: 50,5...
Text Solution
|
- The yearly savings (in rupees) of 30 students of X are as follow: 50,6...
Text Solution
|
- The sale of electric bulbs on different days of a week is shown below:...
Text Solution
|
- The sale of electric bulbs on different days of a week is shown below:...
Text Solution
|
- The sale of electric bulbs on different days of a week is shown below:...
Text Solution
|
- The sale of electric bulbs on different days of a week is shown below:...
Text Solution
|
- The total number of cows in five villages are as follows: Village 1:60...
Text Solution
|
- The total number of cows in five villages are as follows: Village 11:6...
Text Solution
|
- The total number of cows in five villages are as follows: Village 1:60...
Text Solution
|
- The total number of cows in five villages are as follows: Village 11:6...
Text Solution
|
- The total number of cows in five villages are as follows: Village 1:60...
Text Solution
|
- The total number of children of a school in different years is shown i...
Text Solution
|
- The total number of children of a school in different years is shown i...
Text Solution
|
- The total number of children of a school in different years is shown i...
Text Solution
|
- The bar graph given in the adjoining figure represents the number of b...
Text Solution
|
- The bar graph given in the adjoining figure represents the number of b...
Text Solution
|
- The bar graph given in the adjoining figure represents the number of b...
Text Solution
|