Home
Class 6
MATHS
The expenditure(in 10 crores of rupees) ...

The expenditure(in 10 crores of rupees) on health by the Government of India during the various five year plan is shown below:
Construct a bar graph to represent the above data.
.
.

Promotional Banner

Topper's Solved these Questions

Similar Questions

Explore conceptually related problems

Various modes of transport used by 1950 students of a school are given below Draw a graph to represent the above data.

600 students of a school use different mode of transport to go to school s below Draw the bar graph representing the above data.

The results of pass percentage of class X and class XII in CBSE examination for 5 years are given in the following table: Draw bar graphs so as to represent the above data.

The birth rate per thousand in five countries over a priod of time is shown below Represent the above data by a bar graph.

A family with monthly income of Rs. 20,000 had planned the following expenditures under various heads : Draw a bar graph for the above data.

A family with normally income of Rs.40,000 had planned the following expenditure per month under following heads: Draw a bar graph for the above data.

The following table gives the number of students in IX class in a school during the academic years 2012-2013 to 2016-17 Represent the above data by a bar graph.

Given below is a table which shows the year wise strenght of a school. Represent this data by a bar graph

The following data on the number of girls (to the nearest ten) per thousand boys in different sections of Indian Society is given below : : Represent the information above by a bar graph

The following data on the number of girls to the nearest ton per thousand boys in different sections of the society is given below: (i) Represent the information above by a bar graph. (ii) Write two conclusions you can arrive at from the graph, with justification.

MBD-DATA HANDLING-EXERCISE
  1. The total number of cows in five villages are as follows: Village 1:60...

    Text Solution

    |

  2. The total number of children of a school in different years is shown i...

    Text Solution

    |

  3. The total number of children of a school in different years is shown i...

    Text Solution

    |

  4. The total number of children of a school in different years is shown i...

    Text Solution

    |

  5. The bar graph given in the adjoining figure represents the number of b...

    Text Solution

    |

  6. The bar graph given in the adjoining figure represents the number of b...

    Text Solution

    |

  7. The bar graph given in the adjoining figure represents the number of b...

    Text Solution

    |

  8. The bar graph given in the adjoining figure represents the various age...

    Text Solution

    |

  9. The bar graph given in the adjoining figure represents the various age...

    Text Solution

    |

  10. The bar graph given in the adjoining figure represents the various age...

    Text Solution

    |

  11. The number of saplings planted by a farmer in five consecutive weeks ...

    Text Solution

    |

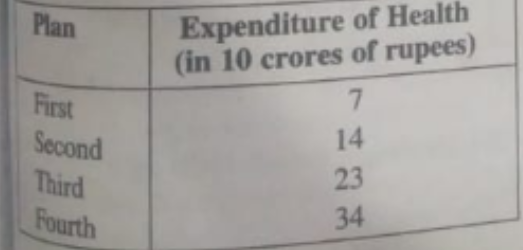
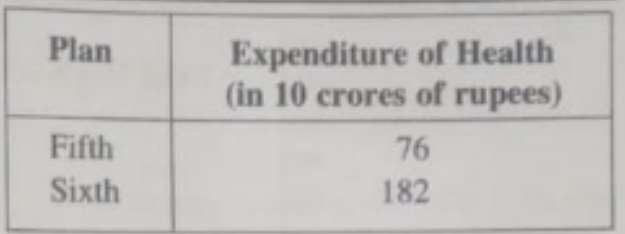
  12. The expenditure(in 10 crores of rupees) on health by the Government of...

    Text Solution

    |

  13. The production of Oil(in lakh tonnes) in some of the refineries in Ind...

    Text Solution

    |

  14. In the adjoining bar graph the growth of population of India from 1951...

    Text Solution

    |

  15. Bar graph given below shows the amount of wheat purchased by governmen...

    Text Solution

    |

  16. Which number is shown by tally mark

    Text Solution

    |

  17. Which number is shown by tally mark . ?

    Text Solution

    |

  18. There is a circuss in a village .The number of children came to see ci...

    Text Solution

    |

  19. There is a circuss in a village .The number of children came to see ci...

    Text Solution

    |

  20. There is a circuss in a village .The number of children came to see ci...

    Text Solution

    |