


Topper's Solved these Questions
Similar Questions
Explore conceptually related problems
MBD-INTRODUCTION OF GRAPHS.-EXERCISE
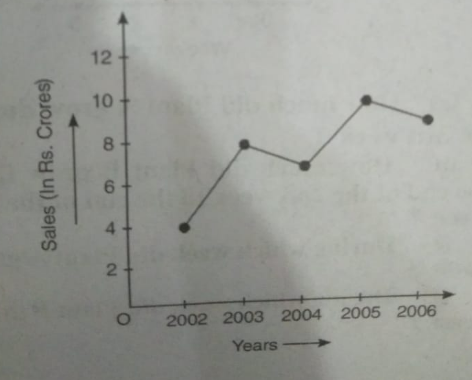
- The following line graph sows the yearly sales figures for a manufactu...
Text Solution
|
- Plot the points(5,0),(0.5),(2,5),(5,2)and (6,3) in the cartesian plane...
Text Solution
|
- Plot the points (-4,7),(3,6),(4,-5) in cartesian plane.Use the scale 1...
Text Solution
|
- What is the name of horizontal and the vertical lines drawn to determi...
Text Solution
|
- Write the name of the point where x-axis and y-axis interesect.
Text Solution
|
- A survey of 120 school students was done to find which activity they p...
Text Solution
|
- Following table shows the number of bicycles manufactured in a factory...
Text Solution
|
- A.......... is used to show comparison among categories.The blank spac...
Text Solution
|
- A .......... is used to compare parts of a whole.The blank space is fi...
Text Solution
|
- A.........is a graph that shows data in intervals.The blank space is f...
Text Solution
|
- A..........displays that changes continously over periods of time.
Text Solution
|
- In order to show the position of a point on the graph paper,we require...
Text Solution
|
- The point were x-axis and y-axis intersect is called :
Text Solution
|