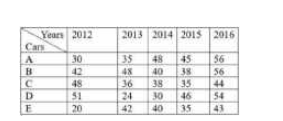
 If the data related to the production of cars of type E is represented by a pie chart, then the central angle of the sector
representing the data of production of cars in 2013 will be:
If the data related to the production of cars of type E is represented by a pie chart, then the central angle of the sector
representing the data of production of cars in 2013 will be: 


PINNACLE-DATA INTERPRETATION-EXERCISE
- The table shows the production of different types of cars (in thousand...
Text Solution
|
- The table shows the production of different types of cars (in thousand...
Text Solution
|
- The table shows the production of different types of cars (in thousand...
Text Solution
|
- The table shows the production of different types of cars (in thousand...
Text Solution
|
- The table below shows the percentage of studying and the ratio of boys...
Text Solution
|
- The table below shows the percentage of students and the ratio of boys...
Text Solution
|
- The table below shows the percentage of students and the ratio of boys...
Text Solution
|
- The table below shows the percentage of students and the ratio of boys...
Text Solution
|
- The table below indicates the percentage of students and the ratio of ...
Text Solution
|
- The table below indicates the percentage of students and the ratio of ...
Text Solution
|
- The table below indicates the percentage of students and the ratio of ...
Text Solution
|
- The table below indicates the percentage of students and the ratio of ...
Text Solution
|
- The given bar graph presents the number of different types of vehicles...
Text Solution
|
- The given bar graph presents the number of different types of vehicles...
Text Solution
|
- The given bar graph presents the number of different types of vehicles...
Text Solution
|
- The given bar graph presents the number of different types of vehicles...
Text Solution
|
- The line diagram shows the temperature of four Sundays of three cities...
Text Solution
|
- The line diagram shows the temperature of four Sundays of three cities...
Text Solution
|
- The line diagram shows the temperature of four Sundays of three cities...
Text Solution
|
- The given pie chart shows runs scored by A in 6 matches. दिया गया पा...
Text Solution
|