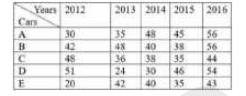
 The total production of type B cars in 2012, 2014 and 2015 taken together is approximately what percent more than the total production of type A cars in 2013 and 2016 taken together?
A
B
C
D
Text Solution
Verified by Experts


PINNACLE-DATA INTERPRETATION-EXERCISE
- The table shows the production of different types of cars (in thousand...
Text Solution
|
- The table shows the production of different types of cars (in thousand...
Text Solution
|
- The table shows the production of different types of cars (in thousand...
Text Solution
|
- The table shows the production of different types of cars (in thousand...
Text Solution
|
- The table below shows the percentage of studying and the ratio of boys...
Text Solution
|
- The table below shows the percentage of students and the ratio of boys...
Text Solution
|
- The table below shows the percentage of students and the ratio of boys...
Text Solution
|
- The table below shows the percentage of students and the ratio of boys...
Text Solution
|
- The table below indicates the percentage of students and the ratio of ...
Text Solution
|
- The table below indicates the percentage of students and the ratio of ...
Text Solution
|
- The table below indicates the percentage of students and the ratio of ...
Text Solution
|
- The table below indicates the percentage of students and the ratio of ...
Text Solution
|
- The given bar graph presents the number of different types of vehicles...
Text Solution
|
- The given bar graph presents the number of different types of vehicles...
Text Solution
|
- The given bar graph presents the number of different types of vehicles...
Text Solution
|
- The given bar graph presents the number of different types of vehicles...
Text Solution
|
- The line diagram shows the temperature of four Sundays of three cities...
Text Solution
|
- The line diagram shows the temperature of four Sundays of three cities...
Text Solution
|
- The line diagram shows the temperature of four Sundays of three cities...
Text Solution
|
- The given pie chart shows runs scored by A in 6 matches. दिया गया पा...
Text Solution
|