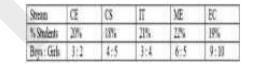
 If the data about the number of girls enrolled in the various streams is represented by a pie-chart, what is the central angle of the sector representing the number of girls in the ME stream, to the nearest whole degree?
 A
B
C
D
Text Solution
Verified by Experts


PINNACLE-DATA INTERPRETATION-EXERCISE
- The table below indicates the percentage of students and the ratio of ...
Text Solution
|
- The table below indicates the percentage of students and the ratio of ...
Text Solution
|
- The table below indicates the percentage of students and the ratio of ...
Text Solution
|
- The table below indicates the percentage of students and the ratio of ...
Text Solution
|
- The given bar graph presents the number of different types of vehicles...
Text Solution
|
- The given bar graph presents the number of different types of vehicles...
Text Solution
|
- The given bar graph presents the number of different types of vehicles...
Text Solution
|
- The given bar graph presents the number of different types of vehicles...
Text Solution
|
- The line diagram shows the temperature of four Sundays of three cities...
Text Solution
|
- The line diagram shows the temperature of four Sundays of three cities...
Text Solution
|
- The line diagram shows the temperature of four Sundays of three cities...
Text Solution
|
- The given pie chart shows runs scored by A in 6 matches. दिया गया पा...
Text Solution
|
- The given pie chart shows runs scored by A in 6 matches. दिया गया पा...
Text Solution
|
- The given pie chart shows runs scored by A in 6 matches. दिया गया पा...
Text Solution
|
- The given bar graph shows the number of marks scored by a student in e...
Text Solution
|
- The given bar graph shows the number of marks scored by a student in e...
Text Solution
|
- The given bar graph shows the number of marks scored by a student in e...
Text Solution
|
- The given bar chart shows the details of cycle sales by a company betw...
Text Solution
|
- The given bar chart shows the details of cycle sales by a company betw...
Text Solution
|
- The given bar chart shows the details of cycle sales by a company betw...
Text Solution
|