Home
Class 14
MATHS
The given pie chart shows runs scored by...

The given pie chart shows runs scored by A in 6 matches.
दिया गया पाई चार्ट A के द्वारा 6 मैचों में बनाए गए रनों को दर्शाता है |
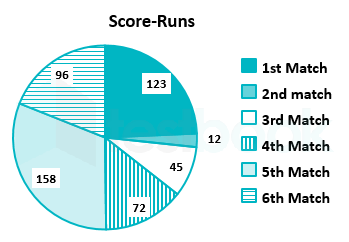
In the given pie-chart, if A scored a century in matches 4 and 6, what would have been her average score? /
इस पाई चार्ट में यदि A ने चौथे और छठे मैच में शतक लगाया होता तो उसका औसत स्कोर क्या रहता ?

A

85

B

90

C

88

D

84

Text Solution

Verified by Experts

Promotional Banner

Topper's Solved these Questions

Similar Questions

Explore conceptually related problems

The given pie chart shows runs scored by A in 6 matches. दिया गया पाई चार्ट A के द्वारा 6 मैचों में बनाए गए रनों को दर्शाता है | In the given pie-chart, what is the increase or decrease in score in match 4 as compared to match 2? / इस पाई चार्ट में मैच 2 की तुलना में मैच 4 के स्कोर में कितनी वृद्धि या कमी हुई है ?

The given pie chart shows runs scored by A in 6 matches In the given pie chart if A scored century in matches 4 and 6, what would have been her average score?

The given pie-chart shows runs scored by A in 6 matches. In the given pie-chart. if A scored a century in matches 4 and 6, What would have been her average score?

The given pie chart shows runs scored by A in 6 matches In the given pie chart what is the average runs scored in all matches

The given pie chart shows the expenditure given in millions on each game. दिया गया पाई चार्ट प्रत्येक खेल पर करोड़ो में दिए गए व्यय को दर्शाता है | In the given pie chart, what is the difference between expenditure on cricket and football ? दिए गए पाई चार्ट में , क्रिकेट और फुटबॉल पर किये गए व्यय के बीच क्या अंतर है ?

The given pie-chart favourite sport of students of a school. दिया गया पाई चार्ट एक विद्यालय के छात्रों के पसंदीदा खेल को दर्शाता है | In the given pie-chart, if the school strength was 2500, how many liked cricket more than hockey? इस पाई चार्ट के अनुसार, यदि विद्यालय में कुल 2500 छात्र थे , तो कितने छात्र क्रिकेट को हॉकी से ज्यादा पसंद करते थे ?

The given pie-chart favourite sport of students of a school. दिया गया पाई चार्ट एक विद्यालय के छात्रों के पसंदीदा खेल को दर्शाता है | In the given pie-chart, if there were 1280 students in all, how many liked football? इस पाई चार्ट के अनुसार, यदि कुल मिलाकर 1280 छात्र हैं, तो फुटबॉल कितने छात्रों को पसंद है ?

The given pie-chart favourite sport of students of a school. दिया गया पाई चार्ट एक विद्यालय के छात्रों के पसंदीदा खेल को दर्शाता है | In the given pie-chart, what is the difference in percentage between liking for football and basketball? इस पाई चार्ट के अनुसार, फुटबॉल तथा बास्केटबॉल पसंद करने के प्रतिशत में क्या अंतर है ?

The given pie-chart shows runs scored by A in 6 matches. In the given pie-chart. what is the average runs scored in all matches? (rounded off)

The given pie-chart shows runs scored by A in 6 matches. In the given pie-chart, what is the increase or decrease in score in match 4 as compared to match 2?

PINNACLE-DATA INTERPRETATION-EXERCISE
  1. The given pie chart shows runs scored by A in 6 matches. दिया गया पा...

    Text Solution

    |

  2. The given pie chart shows runs scored by A in 6 matches. दिया गया पा...

    Text Solution

    |

  3. The given pie chart shows runs scored by A in 6 matches. दिया गया पा...

    Text Solution

    |

  4. The given bar graph shows the number of marks scored by a student in e...

    Text Solution

    |

  5. The given bar graph shows the number of marks scored by a student in e...

    Text Solution

    |

  6. The given bar graph shows the number of marks scored by a student in e...

    Text Solution

    |

  7. The given bar chart shows the details of cycle sales by a company betw...

    Text Solution

    |

  8. The given bar chart shows the details of cycle sales by a company betw...

    Text Solution

    |

  9. The given bar chart shows the details of cycle sales by a company betw...

    Text Solution

    |

  10. The line graph shows the production of product A and B (in thousands) ...

    Text Solution

    |

  11. The line graph shows the production of product A and B (in thousands) ...

    Text Solution

    |

  12. the given pie chart shows the number of tourists for the year 2015, tr...

    Text Solution

    |

  13. The given pie chart shows the number of tourists for the year 2015, tr...

    Text Solution

    |

  14. The given pie chart shows the number of tourists for the year 2015 tra...

    Text Solution

    |

  15. The table shows Income and expenditure of a person for 3 years (in tho...

    Text Solution

    |

  16. The table shows Income and expenditure of a person for 3 years (in tho...

    Text Solution

    |

  17. The table shows Income and expenditure of a person for 3 years (in tho...

    Text Solution

    |

  18. The bar graph shows the exports of Cars of Type A and B (in Rs million...

    Text Solution

    |

  19. What is the ratio of the total exports of cars of type A in 2014 and 2...

    Text Solution

    |

  20. The bar graph shows the exports of Cars of Type A and B (in Rs million...

    Text Solution

    |