Home
Class 14
MATHS
The table shows Income and expenditure o...

The table shows Income and expenditure of a person for 3 years (in thousands)
यह तालिका 3 वर्षों के दौरान किसी व्यक्ति के आय एवं व्यय (हज़ार में ) को दर्शाती है |
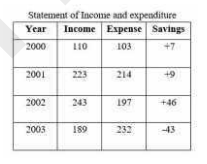
In the given table, what is the percentage of expenditure on income in the year 2002? (round off)
दी गयी तालिका के अनुसार, वर्ष 2002 में आय पर व्यय का प्रतिशत कया है?

A

0.85

B

0.78

C

0.82

D

0.81

Text Solution

Verified by Experts

Promotional Banner

Topper's Solved these Questions

Similar Questions

Explore conceptually related problems

The table shows Income and expenditure of a person for 3 years (in thousands) यह तालिका 3 वर्षों के दौरान किसी व्यक्ति के आय एवं व्यय (हज़ार में ) को दर्शाती है | In the given table, if a person reduced his expenditure by 10% by how much would his total savings increased? दी गयी तालिका के अनुसार यदि व्यक्ति अपने व्यय में 10% की कमी कर ले, तो उसकी बचत में कुल कितनी वृद्धि होगी ?

The table shows Income and expenditure of a person for 3 years (in thousands) यह तालिका 3 वर्षों के दौरान किसी व्यक्ति के आय एवं व्यय (हज़ार में ) को दर्शाती है | In the given table, if a person invested his savings every year at 8% simple interest, how much interest will be earned at the end of 2003? दी गयी तालिका के अनुसार, यदि व्यक्ति ने हर वर्ष अपनी बचत 8% साधारण ब्याज पर निवेश कर दी, तो 2003 के अंत में कितना ब्याज प्राप्त होगा ?

The table shows income and expenditure of a person for 3 years In the given table, what is the percentage of expenditure on income in the year 2002

The table shows Income and expenditure of a person for 3 years (in thousands): In the given table, what is the percentage of expenditure on income in the year 2002?(round off)

As per the data in the table, what is the percentage of students who got 20 or more marks? दी गयी तालिका के आंकड़ों के अनुसार, 20 या अधिक अंक प्राप्त हे वाले छात्रों का प्रतिशत कितना है ?

The table below shows the admission and transfer in standards 1-3 of a school. निम्नलिखित तालिका किसी विद्यालय की कक्षा 1-3 में नामांकन एवं स्थानांतरण को दर्शाती है | In the given table, what was the difference between admission and transfer in standard 3 in year 2016? दी गयी तालिका के अनुसार, वर्ष 2016 में कक्षा 3 में नामांकन तथा स्थानांतरण में क्या अंतर था ?

The table below shows the admission and transfer in standards 1-3 of a school. निम्नलिखित तालिका किसी विद्यालय की कक्षा 1-3 में नामांकन एवं स्थानांतरण को दर्शाती है | In the given table, what was the total strength in Standards 1-3 at the end of 2015? दी गयी तालिका के अनुसार, 2015 के अंत में कक्षा 1-3 की कुल क्षमता क्या थी?

The table below shows the admission and transfer in standards 1-3 of a school. निम्नलिखित तालिका किसी विद्यालय की कक्षा 1-3 में नामांकन एवं स्थानांतरण को दर्शाती है | In the given table, in Standard 1, how many students were there at the end of year 2016? दी गयी तालिका के अनुसार, कक्षा 1 में, 2016 के अंत में कितने छात्र थे ?

The given Bar Graph presents Income and Expenditure (in crores of Rupees) of a company for the five years, 2014 to 2018. दिया गया दंड आरेख पांच वर्षों अर्थात 2014 से 2018 तक एक कंपनी के आय एवं व्यय ( करोड़ रुपये में ) को दर्शाता है | In which year is the Expenditure more than 40% as compared to the Expenditure in the previous year? किस वर्ष में व्यय पिछले वर्ष के व्यय की तुलना में 40% अधिक है ?

The table shows Income and expenditure of a person for 3 years (in thousands): In the given table, if a person reduced his expenditure by 10%, by how much would his total savings increased?

PINNACLE-DATA INTERPRETATION-EXERCISE
  1. The given pie chart shows the number of tourists for the year 2015 tra...

    Text Solution

    |

  2. The table shows Income and expenditure of a person for 3 years (in tho...

    Text Solution

    |

  3. The table shows Income and expenditure of a person for 3 years (in tho...

    Text Solution

    |

  4. The table shows Income and expenditure of a person for 3 years (in tho...

    Text Solution

    |

  5. The bar graph shows the exports of Cars of Type A and B (in Rs million...

    Text Solution

    |

  6. What is the ratio of the total exports of cars of type A in 2014 and 2...

    Text Solution

    |

  7. The bar graph shows the exports of Cars of Type A and B (in Rs million...

    Text Solution

    |

  8. Study the graph and answer the question that follows. आरेख का अध्ययन...

    Text Solution

    |

  9. The given pie chart shows the breakup of total number of the employees...

    Text Solution

    |

  10. The given pie chart shows the breakup of total number of the employees...

    Text Solution

    |

  11. The given pie chart shows the breakup of total number of the employees...

    Text Solution

    |

  12. The given pie chart shows the quantity wise sales distribution of five...

    Text Solution

    |

  13. The given pie chart shows the quantity wise sales distribution of five...

    Text Solution

    |

  14. The given pie chart shows the quantity wise sales distribution of five...

    Text Solution

    |

  15. The total imports of steel in 2014, 2016 and 2017 is what percent less...

    Text Solution

    |

  16. The given bar graph shows the imports and exports (in Rs crores) of st...

    Text Solution

    |

  17. The given bar graph shows the imports and exports (in Rs crores) of st...

    Text Solution

    |

  18. The given graph shows the marks obtained by students in an examination...

    Text Solution

    |

  19. The given graph shows the weights of students in a school on a particu...

    Text Solution

    |

  20. Study the following bar graph and answer the question given. निम्नलि...

    Text Solution

    |