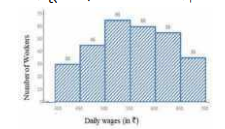
 What is the ratio of the total number of workers whose daily wages are less than Rs 500 to the total number of workers whose daily wages are Rs600 and above?
 A
B
C
D
Text Solution
Verified by Experts


Topper's Solved these Questions
Similar Questions
Explore conceptually related problems
PINNACLE-DATA INTERPRETATION-EXERCISE
- What is the ratio of the total exports of cars of type A in 2014 and 2...
Text Solution
|
- The bar graph shows the exports of Cars of Type A and B (in Rs million...
Text Solution
|
- Study the graph and answer the question that follows. आरेख का अध्ययन...
Text Solution
|
- The given pie chart shows the breakup of total number of the employees...
Text Solution
|
- The given pie chart shows the breakup of total number of the employees...
Text Solution
|
- The given pie chart shows the breakup of total number of the employees...
Text Solution
|
- The given pie chart shows the quantity wise sales distribution of five...
Text Solution
|
- The given pie chart shows the quantity wise sales distribution of five...
Text Solution
|
- The given pie chart shows the quantity wise sales distribution of five...
Text Solution
|
- The total imports of steel in 2014, 2016 and 2017 is what percent less...
Text Solution
|
- The given bar graph shows the imports and exports (in Rs crores) of st...
Text Solution
|
- The given bar graph shows the imports and exports (in Rs crores) of st...
Text Solution
|
- The given graph shows the marks obtained by students in an examination...
Text Solution
|
- The given graph shows the weights of students in a school on a particu...
Text Solution
|
- Study the following bar graph and answer the question given. निम्नलि...
Text Solution
|
- Study the following bar graph and answer the question given. निम्नलि...
Text Solution
|
- Study the following bar graph and answer the question given. निम्नलि...
Text Solution
|
- The given pie-chart shows the break-up of total marks obtained by a st...
Text Solution
|
- The given pie-chart shows the break-up of total marks obtained by a st...
Text Solution
|
- The given pie-chart shows the break-up of total marks obtained by a st...
Text Solution
|