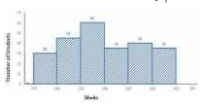
 The number of students who obtained less than 300 marks is what percent more than the number of students who obtained 350 or more marks?
 A
B
C
D
Text Solution
Verified by Experts


Topper's Solved these Questions
Similar Questions
Explore conceptually related problems
PINNACLE-DATA INTERPRETATION-EXERCISE
- The given bar graph shows the imports and exports (in Rs crores) of st...
Text Solution
|
- The given bar graph shows the imports and exports (in Rs crores) of st...
Text Solution
|
- The given graph shows the marks obtained by students in an examination...
Text Solution
|
- The given graph shows the weights of students in a school on a particu...
Text Solution
|
- Study the following bar graph and answer the question given. निम्नलि...
Text Solution
|
- Study the following bar graph and answer the question given. निम्नलि...
Text Solution
|
- Study the following bar graph and answer the question given. निम्नलि...
Text Solution
|
- The given pie-chart shows the break-up of total marks obtained by a st...
Text Solution
|
- The given pie-chart shows the break-up of total marks obtained by a st...
Text Solution
|
- The given pie-chart shows the break-up of total marks obtained by a st...
Text Solution
|
- The table shows the production of different types of cars (in thousand...
Text Solution
|
- The table shows the production of different types of cars (in thousand...
Text Solution
|
- The table shows the production of different types of cars (in thousand...
Text Solution
|
- The table shows the production of different types of cars (in thousand...
Text Solution
|
- The table shows the production of different types of cars (in thousand...
Text Solution
|
- The table shows the production of different types of cars (in thousand...
Text Solution
|
- The table shows the production of different types of cars (in thousand...
Text Solution
|
- The table shows the production of different types of cars (in thousand...
Text Solution
|
- The table shows the production of different types of cars by a company...
Text Solution
|
- The total production of type B cars in 2015 and type D cars 2016 is wh...
Text Solution
|