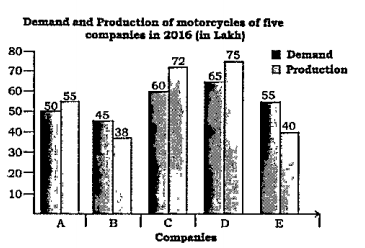
 The number of companies whose production of motorcycles is equal to or more than the average demand of motorcycles (per year) over five years is:
 A
B
C
D
Text Solution
Verified by Experts


Topper's Solved these Questions
Similar Questions
Explore conceptually related problems
PINNACLE-DATA INTERPRETATION-EXERCISE
- Study the following bar graph and answer the question given. निम्नलि...
Text Solution
|
- Study the following bar graph and answer the question given. निम्नलि...
Text Solution
|
- Study the following bar graph and answer the question given. निम्नलि...
Text Solution
|
- The given pie-chart shows the break-up of total marks obtained by a st...
Text Solution
|
- The given pie-chart shows the break-up of total marks obtained by a st...
Text Solution
|
- The given pie-chart shows the break-up of total marks obtained by a st...
Text Solution
|
- The table shows the production of different types of cars (in thousand...
Text Solution
|
- The table shows the production of different types of cars (in thousand...
Text Solution
|
- The table shows the production of different types of cars (in thousand...
Text Solution
|
- The table shows the production of different types of cars (in thousand...
Text Solution
|
- The table shows the production of different types of cars (in thousand...
Text Solution
|
- The table shows the production of different types of cars (in thousand...
Text Solution
|
- The table shows the production of different types of cars (in thousand...
Text Solution
|
- The table shows the production of different types of cars (in thousand...
Text Solution
|
- The table shows the production of different types of cars by a company...
Text Solution
|
- The total production of type B cars in 2015 and type D cars 2016 is wh...
Text Solution
|
- The table shows the production of different types of cars by a company...
Text Solution
|
- The table shows the production of different types of cars (in thousand...
Text Solution
|
- The table shows the production of different types of cars (in thousand...
Text Solution
|
- The table shows the production of different types of cars (in thousand...
Text Solution
|