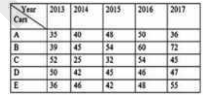
 The total production of cars of types B in 2013, 2014, 2015 and 2017 taken together is what
percent less than the total production of all types of cars in 2017? (correct to one decimal place)
The total production of cars of types B in 2013, 2014, 2015 and 2017 taken together is what
percent less than the total production of all types of cars in 2017? (correct to one decimal place) A
B
C
D
Text Solution
Verified by Experts


Topper's Solved these Questions
Similar Questions
Explore conceptually related problems
PINNACLE-DATA INTERPRETATION-EXERCISE
- The given pie-chart shows the break-up of total marks obtained by a st...
Text Solution
|
- The table shows the production of different types of cars (in thousand...
Text Solution
|
- The table shows the production of different types of cars (in thousand...
Text Solution
|
- The table shows the production of different types of cars (in thousand...
Text Solution
|
- The table shows the production of different types of cars (in thousand...
Text Solution
|
- The table shows the production of different types of cars (in thousand...
Text Solution
|
- The table shows the production of different types of cars (in thousand...
Text Solution
|
- The table shows the production of different types of cars (in thousand...
Text Solution
|
- The table shows the production of different types of cars (in thousand...
Text Solution
|
- The table shows the production of different types of cars by a company...
Text Solution
|
- The total production of type B cars in 2015 and type D cars 2016 is wh...
Text Solution
|
- The table shows the production of different types of cars by a company...
Text Solution
|
- The table shows the production of different types of cars (in thousand...
Text Solution
|
- The table shows the production of different types of cars (in thousand...
Text Solution
|
- The table shows the production of different types of cars (in thousand...
Text Solution
|
- The table shows the production of different types of cars (in thousand...
Text Solution
|
- The table shows the production of different types of cars (in thousand...
Text Solution
|
- The table shows the production of different types of cars (in thousand...
Text Solution
|
- The table shows the production of different types of cars (in thousand...
Text Solution
|
- The table shows the production of different types of cars (in thousand...
Text Solution
|