Home
Class 14
MATHS
The table shows the production of differ...

The table shows the production of different types of cars (in thousands)
यह तालिका अलग-अलग प्रकार के कारों का उत्पादन ( हज़ार में ) दर्शाती है |
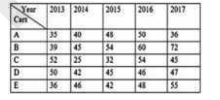
The ratio of the total production of cars of type C and E taken together in 2013 to the total production of cars of type D in 2014 and 2016 and type E in 2017 taken together is:
2013 में C और E प्रकार की कारों के कुल उत्पादन का 2014 और 2016 में D तथा 2017 में E प्रकार की कारों के कुल उत्पादन के साथ अनुपात ज्ञात करें |

A

`8:13`

B

`5:8`

C

`13:32`

D

`8:11`

Text Solution

Verified by Experts

Promotional Banner

Topper's Solved these Questions

Similar Questions

Explore conceptually related problems

The table shows the production of different types of cars (in thousands). यह तालिका अलग-अलग प्रकार के कारों का उत्पादन ( हज़ार में) दर्शाती है | What is the ratio of the total production of cars of type A in 2014 and type C in 2013 taken together to the total production of cars of type B in 2016 and type E in 2015 taken together? 2014 में A प्रकार की कारों और 2013 में C प्रकार की कारों के कु ल उत्पादन का 2016 में B प्रकार की कारों और 2015 में E प्रकार की कारों के कुल उत्पादन के साथ अनुपात ज्ञात करें |

The table shows the production of different types of cars (in thousands). यह तालिका एक कंपनी द्वारा अलग-अलग कारों के उत्पादन (हज़ार में ) को दर्शाती है | What is the ratio of the total production of type C and D cars in 2012 to the total production of type A cars in 2014 and type E cars in 2015? 2012 में C और D प्रकार की कारों के कुल उत्पादन का 2014 में A प्रकार तथा 2015 में E प्रकार की कारों के कुल उत्पादन के साथ अनुपात ज्ञात करें |

The table shows the production of different types of cars (in thousands). यह तालिका अलग-अलग प्रकार के कारों का उत्पादन ( हज़ार में) दर्शाती है | The total production of type B cars in 2012, 2014 and 2015 taken together is approximately what percent more than the total production of type A cars in 2013 and 2016 taken together? 2012, 2014 और 2015 में B प्रकार की कारों का कुल उत्पादन 2013 एवं 2016 में A प्रकार की कारों के कुल उत्पादन से लगभग कितना प्रतिशत अधिक है ?

The table shows the production of different types of cars (in thousands). यह तालिका एक कंपनी द्वारा अलग-अलग कारों के उत्पादन ( हज़ार में ) को दर्शाती है | The ratio of the total production of type A cars in 2017 and type D cars in 2015 to the total production of type B and type E cars in 2013 is: 2017 में A प्रकार तथा 2015 में प्रकार की कारों के कुल उत्पादन का 2013 में B और E प्रकार की कारों के कुल उत्पादन के साथ अनुपात ज्ञात करें |

The table shows the production of different types of cars (in thousands) यह तालिका अलग-अलग प्रकार के कारों का उत्पादन ( हज़ार में ) दर्शाती है | The total production of cars of types B in 2013, 2014, 2015 and 2017 taken together is what percent less than the total production of all types of cars in 2017? (correct to one decimal place) 2013, 2014, 2015 और 2017 में B प्रकार की कारों का कुल उत्पादन 2017 में सभी प्रकार की कारों के कुल उत्पादन से कितना प्रतिशत कम है ?

The table shows the production of different types of cars (in thousands). यह तालिका एक कंपनी द्वारा 5 वर्षों में अलग-अलग कारों के उत्पादन (हज़ार में ) को दर्शाती है | What is the ratio of the total production of type E cars in 2014 and type C cars in 2016 taken together to the total production of type B cars in 2014 and type D cars in 2013 taken together? 2014 में E प्रकार तथा 2016 में C प्रकार की कारों के कुल उत्पादन का 2014 में B प्रकार तथा 2013 में D प्रकार की कारों के कुल उत्पादन के साथ अनुपात ज्ञात करें |

The table shows the production of different types of cars (in thousands). यह तालिका एक कंपनी द्वारा अलग-अलग कारों के उत्पादन (हज़ार में ) को दर्शाती है | What is the ratio of the total production of type A cars in 2017 and type C cars in 2014 taken together to the total production of type B cars in 2014, type C cars in 2017 and type E cars in 2018 taken together? 2017 में A प्रकार तथा 2014 में C प्रकार की कारों के कुल उत्पादन का 2014 में B प्रकार, 2017 में C प्रकार तथा 2018 में E प्रकार की कारों के कुल उत्पादन के साथ अनुपात ज्ञात करें |

The table shows the production of different types of cars (in thousands). यह तालिका एक कंपनी द्वारा अलग-अलग कारों के उत्पादन (हज़ार में ) को दर्शाती है | What is the ratio of the total production of type B cars in 2011 and type E cars in 2013 taken together to the total production of type C cars in 2014 and type D cars in 2012 taken together? 2011 में B प्रकार एवं 2013 में E प्रकार की कारों के कुल उत्पादन ( संयुक्त रूप से ) का 2014 में C प्रकार और 2012 में D प्रकार की कारों के कुल उत्पादन के साथ अनुपात ज्ञात करें |

PINNACLE-DATA INTERPRETATION-EXERCISE
  1. The table shows the production of different types of cars (in thousand...

    Text Solution

    |

  2. The table shows the production of different types of cars (in thousand...

    Text Solution

    |

  3. The table shows the production of different types of cars (in thousand...

    Text Solution

    |

  4. The table shows the production of different types of cars (in thousand...

    Text Solution

    |

  5. The table shows the production of different types of cars (in thousand...

    Text Solution

    |

  6. The table shows the production of different types of cars (in thousand...

    Text Solution

    |

  7. The table shows the production of different types of cars (in thousand...

    Text Solution

    |

  8. The table shows the production of different types of cars (in thousand...

    Text Solution

    |

  9. The table shows the production of different types of cars by a company...

    Text Solution

    |

  10. The total production of type B cars in 2015 and type D cars 2016 is wh...

    Text Solution

    |

  11. The table shows the production of different types of cars by a company...

    Text Solution

    |

  12. The table shows the production of different types of cars (in thousand...

    Text Solution

    |

  13. The table shows the production of different types of cars (in thousand...

    Text Solution

    |

  14. The table shows the production of different types of cars (in thousand...

    Text Solution

    |

  15. The table shows the production of different types of cars (in thousand...

    Text Solution

    |

  16. The table shows the production of different types of cars (in thousand...

    Text Solution

    |

  17. The table shows the production of different types of cars (in thousand...

    Text Solution

    |

  18. The table shows the production of different types of cars (in thousand...

    Text Solution

    |

  19. The table shows the production of different types of cars (in thousand...

    Text Solution

    |

  20. The table shows the production of different types of cars (in thousand...

    Text Solution

    |