Home
Class 14
MATHS
The table shows the production of differ...

The table shows the production of different types of cars (in thousands).
यह तालिका एक कंपनी द्वारा अलग-अलग कारों के उत्पादन (हज़ार में ) को दर्शाती है |
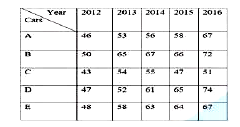
What is the ratio of the total production of type C and D cars in 2012 to the total production of type A cars in 2014 and type E cars in 2015?
2012 में C और D प्रकार की कारों के कुल उत्पादन का 2014 में A प्रकार तथा 2015 में E प्रकार की कारों के कुल उत्पादन के साथ अनुपात ज्ञात करें |

A

`5 : 6`

B

`9:11`

C

`3 : 4`

D

`11:12`

Text Solution

Verified by Experts

The correct Answer is:
C
Promotional Banner

Topper's Solved these Questions

Similar Questions

Explore conceptually related problems

The table shows the production of different types of cars (in thousands). यह तालिका एक कंपनी द्वारा अलग-अलग कारों के उत्पादन ( हज़ार में ) को दर्शाती है | The ratio of the total production of type A cars in 2017 and type D cars in 2015 to the total production of type B and type E cars in 2013 is: 2017 में A प्रकार तथा 2015 में प्रकार की कारों के कुल उत्पादन का 2013 में B और E प्रकार की कारों के कुल उत्पादन के साथ अनुपात ज्ञात करें |

The table shows the production of different types of cars (in thousands). यह तालिका एक कंपनी द्वारा अलग-अलग कारों के उत्पादन ( हज़ार में ) को दर्शाती है | The average production of type C cars during 2012 to 2016 is approximately what percent less than the total production of type D cars in 2012 and type E cars in 2014? 2012 से 2016 के दौरान C प्रकार की कारों का औसत उत्पादन 2012 में D प्रकार एवं 2014 में E प्रकार की कारों के कुल उत्पादन से लगभग कितना प्रतिशत कम है ?

The table shows the production of different types of cars (in thousands). यह तालिका एक कंपनी द्वारा अलग-अलग कारों के उत्पादन (हज़ार में ) को दर्शाती है | The average production of all type of cars in 2014 is approximately what percent less than the total production of type B cars in 2013 and type D cars in 2010 taken together? 2014 में सभी प्रकार की कारों का औसत उत्पादन 2013 में B प्रकार तथा 2010 में D प्रकार की कारों के कुल उत्पादन से लगभग कितना प्रतिशत कम है ?

The table shows the production of different types of cars (in thousands). यह तालिका एक कंपनी द्वारा अलग-अलग कारों के उत्पादन (हज़ार में ) को दर्शाती है | What is the ratio of the total production of type B cars in 2011 and type E cars in 2013 taken together to the total production of type C cars in 2014 and type D cars in 2012 taken together? 2011 में B प्रकार एवं 2013 में E प्रकार की कारों के कुल उत्पादन ( संयुक्त रूप से ) का 2014 में C प्रकार और 2012 में D प्रकार की कारों के कुल उत्पादन के साथ अनुपात ज्ञात करें |

The table shows the production of different types of cars (in thousands). यह तालिका एक कंपनी द्वारा अलग-अलग कारों के उत्पादन (हज़ार में ) को दर्शाती है | What is the ratio of the total production of type A cars in 2017 and type C cars in 2014 taken together to the total production of type B cars in 2014, type C cars in 2017 and type E cars in 2018 taken together? 2017 में A प्रकार तथा 2014 में C प्रकार की कारों के कुल उत्पादन का 2014 में B प्रकार, 2017 में C प्रकार तथा 2018 में E प्रकार की कारों के कुल उत्पादन के साथ अनुपात ज्ञात करें |

The table shows the production of different types of cars (in thousands). यह तालिका एक कंपनी द्वारा 5 वर्षों में अलग-अलग कारों के उत्पादन (हज़ार में ) को दर्शाती है | What is the ratio of the total production of type E cars in 2014 and type C cars in 2016 taken together to the total production of type B cars in 2014 and type D cars in 2013 taken together? 2014 में E प्रकार तथा 2016 में C प्रकार की कारों के कुल उत्पादन का 2014 में B प्रकार तथा 2013 में D प्रकार की कारों के कुल उत्पादन के साथ अनुपात ज्ञात करें |

The table shows the production of different types of cars (in thousands) यह तालिका अलग-अलग प्रकार के कारों का उत्पादन ( हज़ार में ) दर्शाती है | The ratio of the total production of cars of type C and E taken together in 2013 to the total production of cars of type D in 2014 and 2016 and type E in 2017 taken together is: 2013 में C और E प्रकार की कारों के कुल उत्पादन का 2014 और 2016 में D तथा 2017 में E प्रकार की कारों के कुल उत्पादन के साथ अनुपात ज्ञात करें |

The table shows the production of different types of cars (in thousands). यह तालिका एक कंपनी द्वारा अलग-अलग कारों के उत्पादन ( हज़ार में ) को दर्शाती है | The ratio of the total production of type A cars in 2014 and 2016 and type C cars in 2013 taken together to the total production of type B cars and type D cars taken together in 2014 is: 2014 तथा 2016 में A प्रकार एवं 2013 में C प्रकार की कारों के कुल उत्पादन ( संयुक्त रूप से ) का 2014 में B प्रकार और D प्रकार की कारों के कुल उत्पादन के साथ अनुपात ज्ञात करें |

The table shows the production of different types of cars (in thousands). यह तालिका एक कंपनी द्वारा अलग-अलग कारों के उत्पादन (हज़ार में ) को दर्शाती है | The total production of type B cars in 2015 and type D cars 2016 is what percent less than the total production of type E cars in five years? 2015 में B प्रकार तथा 2016 में D प्रकार की कारों का कुल उत्पादन पांच वर्षों में E प्रकार की कारों के कुल उत्पादन से कितना प्रतिशत कम है?

PINNACLE-DATA INTERPRETATION-EXERCISE
  1. The table shows the production of different types of cars (in thousand...

    Text Solution

    |

  2. The table shows the production of different types of cars (in thousand...

    Text Solution

    |

  3. The table shows the production of different types of cars (in thousand...

    Text Solution

    |

  4. The table shows the production of different types of cars (in thousand...

    Text Solution

    |

  5. The table shows the production of different types of cars (in thousand...

    Text Solution

    |

  6. The table below shows the number of students enrolled in five colleges...

    Text Solution

    |

  7. The table below shows the number of students enrolled in five colleges...

    Text Solution

    |

  8. The table below shows the number of students enrolled in five colleges...

    Text Solution

    |

  9. The table below shows the number of students enrolled in five colleges...

    Text Solution

    |

  10. The following table indicates the number of students studying in three...

    Text Solution

    |

  11. The following table indicates the number of students studying in three...

    Text Solution

    |

  12. IF a pie chart is drawn representive the number of students in all fiv...

    Text Solution

    |

  13. The following table indicates the number of students studying in three...

    Text Solution

    |

  14. This table shows the number of students studying in various streams in...

    Text Solution

    |

  15. This table shows the number of students studying in various streams in...

    Text Solution

    |

  16. This table shows the number of students studying in various streams in...

    Text Solution

    |

  17. IF the data about students of the commerce stream in all colleges is r...

    Text Solution

    |

  18. The following table shows the percentage distribution of students in v...

    Text Solution

    |

  19. What is the average number of students from the science discipline of ...

    Text Solution

    |

  20. The number of students from the discipine of Economics from college B ...

    Text Solution

    |