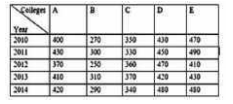
 In the year 2014, what percent of students were enrolled in college C (correct to one decimal place)?
 A
B
C
D
Text Solution
Verified by Experts


PINNACLE-DATA INTERPRETATION-EXERCISE
- The table shows the production of different types of cars (in thousand...
Text Solution
|
- The table below shows the number of students enrolled in five colleges...
Text Solution
|
- The table below shows the number of students enrolled in five colleges...
Text Solution
|
- The table below shows the number of students enrolled in five colleges...
Text Solution
|
- The table below shows the number of students enrolled in five colleges...
Text Solution
|
- The following table indicates the number of students studying in three...
Text Solution
|
- The following table indicates the number of students studying in three...
Text Solution
|
- IF a pie chart is drawn representive the number of students in all fiv...
Text Solution
|
- The following table indicates the number of students studying in three...
Text Solution
|
- This table shows the number of students studying in various streams in...
Text Solution
|
- This table shows the number of students studying in various streams in...
Text Solution
|
- This table shows the number of students studying in various streams in...
Text Solution
|
- IF the data about students of the commerce stream in all colleges is r...
Text Solution
|
- The following table shows the percentage distribution of students in v...
Text Solution
|
- What is the average number of students from the science discipline of ...
Text Solution
|
- The number of students from the discipine of Economics from college B ...
Text Solution
|
- The following table shows the percentage distribution of students in v...
Text Solution
|
- Table shows the production of rice (in million tonnes) of three states...
Text Solution
|
- Table shows the production of rice (in million tonnes) of three states...
Text Solution
|
- What is the percentage increase in the production of rice in B from 20...
Text Solution
|