A
B
C
D
Text Solution
Verified by Experts


Topper's Solved these Questions
Similar Questions
Explore conceptually related problems
PINNACLE-DATA INTERPRETATION-EXERCISE
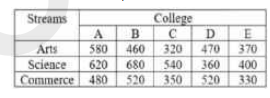
- This table shows the number of students studying in various streams in...
Text Solution
|
- This table shows the number of students studying in various streams in...
Text Solution
|
- This table shows the number of students studying in various streams in...
Text Solution
|
- IF the data about students of the commerce stream in all colleges is r...
Text Solution
|
- The following table shows the percentage distribution of students in v...
Text Solution
|
- What is the average number of students from the science discipline of ...
Text Solution
|
- The number of students from the discipine of Economics from college B ...
Text Solution
|
- The following table shows the percentage distribution of students in v...
Text Solution
|
- Table shows the production of rice (in million tonnes) of three states...
Text Solution
|
- Table shows the production of rice (in million tonnes) of three states...
Text Solution
|
- What is the percentage increase in the production of rice in B from 20...
Text Solution
|
- This table shows the percentage of students passing out of five differ...
Text Solution
|
- This table shows the percentage of students passing out of five differ...
Text Solution
|
- This table shows the percentage of students passing out of five differ...
Text Solution
|
- This table shows the percentage of students passing out of five differ...
Text Solution
|
- The table shows the number of cars sold by three showrooms over a peri...
Text Solution
|
- The Table shows the number of cars sold by three showrooms over a peri...
Text Solution
|
- The table shows the number of cars sold by three showrooms over a peri...
Text Solution
|
- The table shows the number of cars sold by three showrooms over a peri...
Text Solution
|
- Table shows the percentage distribution of the expenditure incurred on...
Text Solution
|