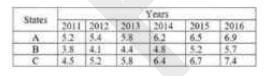
 What is the ratio of the production of rice in all three states in the year 2014 to that in 2016?
 A
B
C
D
Text Solution
Verified by Experts


PINNACLE-DATA INTERPRETATION-EXERCISE
- The number of students from the discipine of Economics from college B ...
Text Solution
|
- The following table shows the percentage distribution of students in v...
Text Solution
|
- Table shows the production of rice (in million tonnes) of three states...
Text Solution
|
- Table shows the production of rice (in million tonnes) of three states...
Text Solution
|
- What is the percentage increase in the production of rice in B from 20...
Text Solution
|
- This table shows the percentage of students passing out of five differ...
Text Solution
|
- This table shows the percentage of students passing out of five differ...
Text Solution
|
- This table shows the percentage of students passing out of five differ...
Text Solution
|
- This table shows the percentage of students passing out of five differ...
Text Solution
|
- The table shows the number of cars sold by three showrooms over a peri...
Text Solution
|
- The Table shows the number of cars sold by three showrooms over a peri...
Text Solution
|
- The table shows the number of cars sold by three showrooms over a peri...
Text Solution
|
- The table shows the number of cars sold by three showrooms over a peri...
Text Solution
|
- Table shows the percentage distribution of the expenditure incurred on...
Text Solution
|
- Table shows the percentage of marks obtained by seven students in six ...
Text Solution
|
- Table shows the sales of books (in thousands) from six branches of a p...
Text Solution
|
- Table shows the annual Expenditure of a company over the years Wh...
Text Solution
|
- The given Bar Graph presents the Target and Actual production of AC Ma...
Text Solution
|
- The given Bar Graph presents the Target and Actual production of AC Ma...
Text Solution
|
- The actual production of Ac machines in April was that percentage mor...
Text Solution
|