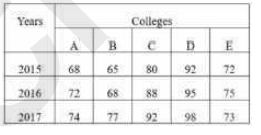
 What is the ratio of the number of students passing to those failing from college E in the year 2015?
 A
B
C
D
Text Solution
Verified by Experts


PINNACLE-DATA INTERPRETATION-EXERCISE
- This table shows the percentage of students passing out of five differ...
Text Solution
|
- This table shows the percentage of students passing out of five differ...
Text Solution
|
- This table shows the percentage of students passing out of five differ...
Text Solution
|
- This table shows the percentage of students passing out of five differ...
Text Solution
|
- The table shows the number of cars sold by three showrooms over a peri...
Text Solution
|
- The Table shows the number of cars sold by three showrooms over a peri...
Text Solution
|
- The table shows the number of cars sold by three showrooms over a peri...
Text Solution
|
- The table shows the number of cars sold by three showrooms over a peri...
Text Solution
|
- Table shows the percentage distribution of the expenditure incurred on...
Text Solution
|
- Table shows the percentage of marks obtained by seven students in six ...
Text Solution
|
- Table shows the sales of books (in thousands) from six branches of a p...
Text Solution
|
- Table shows the annual Expenditure of a company over the years Wh...
Text Solution
|
- The given Bar Graph presents the Target and Actual production of AC Ma...
Text Solution
|
- The given Bar Graph presents the Target and Actual production of AC Ma...
Text Solution
|
- The actual production of Ac machines in April was that percentage mor...
Text Solution
|
- In which month the actual production of AC machines was 25% more than ...
Text Solution
|
- The given Bar graph present the number of students from Science and Ar...
Text Solution
|
- The given Bar graph present the number of students from Science and Ar...
Text Solution
|
- The given bar graph presents the number of students from Science and A...
Text Solution
|
- The given Bar graph present the number of students from Science and Ar...
Text Solution
|