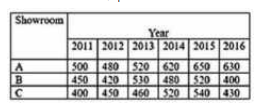
 By what percent did the total number of cars sold by all three showrooms decrease during the year 2016, as compared to that in the year 2015 (nearest to one decimal place)?
 A
B
C
D
Text Solution
Verified by Experts


PINNACLE-DATA INTERPRETATION-EXERCISE
- The table shows the number of cars sold by three showrooms over a peri...
Text Solution
|
- The Table shows the number of cars sold by three showrooms over a peri...
Text Solution
|
- The table shows the number of cars sold by three showrooms over a peri...
Text Solution
|
- The table shows the number of cars sold by three showrooms over a peri...
Text Solution
|
- Table shows the percentage distribution of the expenditure incurred on...
Text Solution
|
- Table shows the percentage of marks obtained by seven students in six ...
Text Solution
|
- Table shows the sales of books (in thousands) from six branches of a p...
Text Solution
|
- Table shows the annual Expenditure of a company over the years Wh...
Text Solution
|
- The given Bar Graph presents the Target and Actual production of AC Ma...
Text Solution
|
- The given Bar Graph presents the Target and Actual production of AC Ma...
Text Solution
|
- The actual production of Ac machines in April was that percentage mor...
Text Solution
|
- In which month the actual production of AC machines was 25% more than ...
Text Solution
|
- The given Bar graph present the number of students from Science and Ar...
Text Solution
|
- The given Bar graph present the number of students from Science and Ar...
Text Solution
|
- The given bar graph presents the number of students from Science and A...
Text Solution
|
- The given Bar graph present the number of students from Science and Ar...
Text Solution
|
- The given Bar graph presents the Demand and Production of motorcycles ...
Text Solution
|
- The given Bar graph presents the Demand and Production of motorcycles ...
Text Solution
|
- The total production of motorcycles of companies B and D taken togethe...
Text Solution
|
- The given Bar graph presents the Demand and Production of motorcycles ...
Text Solution
|