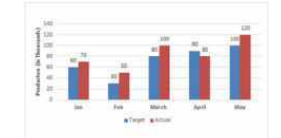
 The ratio of the combined target production of AC Machines in January and April to that of the combined actual production of AC Machines in March and April was:
 A
B
C
D
Text Solution
Verified by Experts


PINNACLE-DATA INTERPRETATION-EXERCISE
- Table shows the sales of books (in thousands) from six branches of a p...
Text Solution
|
- Table shows the annual Expenditure of a company over the years Wh...
Text Solution
|
- The given Bar Graph presents the Target and Actual production of AC Ma...
Text Solution
|
- The given Bar Graph presents the Target and Actual production of AC Ma...
Text Solution
|
- The actual production of Ac machines in April was that percentage mor...
Text Solution
|
- In which month the actual production of AC machines was 25% more than ...
Text Solution
|
- The given Bar graph present the number of students from Science and Ar...
Text Solution
|
- The given Bar graph present the number of students from Science and Ar...
Text Solution
|
- The given bar graph presents the number of students from Science and A...
Text Solution
|
- The given Bar graph present the number of students from Science and Ar...
Text Solution
|
- The given Bar graph presents the Demand and Production of motorcycles ...
Text Solution
|
- The given Bar graph presents the Demand and Production of motorcycles ...
Text Solution
|
- The total production of motorcycles of companies B and D taken togethe...
Text Solution
|
- The given Bar graph presents the Demand and Production of motorcycles ...
Text Solution
|
- The given Bar Graph presents Different Type of Vehicles (in lakhs) exp...
Text Solution
|
- The given Bar Graph presents Different Type of Vehicles (in lakhs) exp...
Text Solution
|
- The given Bar Graph presents Different Type of Vehicles (in lakhs) exp...
Text Solution
|
- The given Bar Graph presents Different Type of Vehicles (in lakhs) exp...
Text Solution
|
- The given Bar Graph presents the number of students enrolled for a voc...
Text Solution
|
- The given Bar Graph presents the number of students enrolled for a voc...
Text Solution
|