Home
Class 14
MATHS
The given bar graph presents the number ...

The given bar graph presents the number of students from Science and Arts streams from a school in different years.
दिया गया दंड आरेख अलग-अलग वर्षों में एक विद्यालय में विज्ञान एवं कला संकाय के छात्रों की संख्या को दर्शाता है |
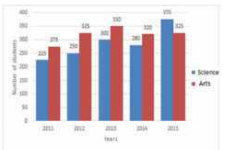
What is the ratio of the total number of Science students in 2011 and 2015 to that of Arts in 2012 and 2015?
2011 तथा 2015 में विज्ञान के छात्रों की कुल संख्या का 2012 तथा 2015 में कला के छात्रों की कुल संख्या के साथ अनुपात ज्ञात करें |

A

`9:10`

B

`8:9`

C

`12:13`

D

`11:12`

Text Solution

Verified by Experts

Promotional Banner

Topper's Solved these Questions

Similar Questions

Explore conceptually related problems

The given Bar graph presents the numbers of students from Science and Arts streams from a school in different years. In which year the number of Arts students is 30% more than that of Science?

The given Bar Graph presents the number of students of two schools for six years. दिया गया दंड आरेख छः वर्ष की अवधि में दो विद्यालयों में छात्रों की संख्या को दर्शाता है | What is the ratio of the number of students taken for all years together from school A to that from school B? सभी वर्षों को मिलाकर विद्यालय A और विद्यालय B के छात्रों की संख्या में अनुपात ज्ञात करें |

The given Bar Graph presents the number of students of two schools for six years. दिया गया दंड आरेख छः वर्ष की अवधि में दो विद्यालयों में छात्रों की संख्या को दर्शाता है | What is the ratio of the number of students taken together for the years 2008, 2012 and 2013 in School A to the number of students taken together for the years 2008, 2012 and 2013 in school B? विद्यालय A में 2008, 2012 तथा 2013 को मिलाकर छात्रों की संख्या का विद्यालय B में 2008, 2012 तथा 2013 को मिलाकर होने वाले छात्रों की संख्या के साथ अनुपात ज्ञात करें |

The given Bar Graph presents the number of students of two schools for six years. दिया गया दंड आरेख छः वर्ष की अवधि में दो विद्यालयों में छात्रों की संख्या को दर्शाता है | What is the average of the number of students from school A during the six year period? छः वर्षों की अवधि में विद्यालय A के छात्रों की संख्या का औसत ज्ञात करें |

The given Bar Graph presents Income and Expenditure (in crores of Rupees) of a company for the five years, 2014 to 2018. दिया गया दंड आरेख पांच वर्षों अर्थात 2014 से 2018 तक एक कंपनी के आय एवं व्यय ( करोड़ रुपये में ) को दर्शाता है | What is the ratio of the total revenue of the company in 2015 and 2018 to that of its expenditure in 2014 and 2018? 2015 तथा 2018 में कंपनी की कुल आय और 2014 तथा 2018 में कंपनी के कुल व्यय में क्या अनुपात है ?

The Table shows the number of students from different schools playing different games. यह तालिका अलग-अलग विद्यालयों के छात्रों की संख्या को दर्शाती है जो अलग-अलग खेल खेलते हैं ? What is the ratio of the total students who play cricket in schools A and B together to the total students who play hockey in schools C and D ? विद्यालय A और B में क्रिकेट खेलने वाले छात्रों की कुल संख्या का विद्यालय C और D में हॉकी खेलने वाले छात्रों की कुल संख्या के साथ क्या अनुपात है ?

The given Bar Graph presents the number of students of two schools for six years. दिया गया दंड आरेख छः वर्ष की अवधि में दो विद्यालयों में छात्रों की संख्या को दर्शाता है | What is the average number of students from school B during the six year period (correct to two decimal places)? छः वर्षों की अवधि में विद्यालय B के छात्रों की औसत संख्या कितनी रही है? (दशमलव के दो स्थान तक )

The given Bar Graph presents the number of students of two schools for six years. दिया गया दंड आरेख छः वर्ष की अवधि में दो विद्यालयों में छात्रों की संख्या को दर्शाता है | In which year the sum of the students in two schools is the highest? किस वर्ष, दोनों विद्यालयों के छात्रों का जोड़ सबसे अधिक है ?

The given Bar Graph presents the number of students of two schools for six years. दिया गया दंड आरेख छः वर्ष की अवधि में दो विद्यालयों में छात्रों की संख्या को दर्शाता है | What is the average (correct to two decimal places) of total students in schools A and B taken together during the six year period? विद्यालय A और B को मिलाकर छः वर्ष की अवधि के दौरान कुल छात्रों का औसत ( दो दशमलव स्थान तक ) क्या है?

The given bar graph shows the number of students of two schools over a period of six years. दिया गया दंड आरेख छह साल की अवधि में दो स्कूलों के छात्रों की संख्या को दर्शाता है। In the bar graph, what is the ratio of the students taken for the years 2008, 2012, 2013 together from school A to the students taken for the years 2009, 2010, 2011 together from school B?

PINNACLE-DATA INTERPRETATION-EXERCISE
  1. The given Bar graph present the number of students from Science and Ar...

    Text Solution

    |

  2. The given Bar graph present the number of students from Science and Ar...

    Text Solution

    |

  3. The given bar graph presents the number of students from Science and A...

    Text Solution

    |

  4. The given Bar graph present the number of students from Science and Ar...

    Text Solution

    |

  5. The given Bar graph presents the Demand and Production of motorcycles ...

    Text Solution

    |

  6. The given Bar graph presents the Demand and Production of motorcycles ...

    Text Solution

    |

  7. The total production of motorcycles of companies B and D taken togethe...

    Text Solution

    |

  8. The given Bar graph presents the Demand and Production of motorcycles ...

    Text Solution

    |

  9. The given Bar Graph presents Different Type of Vehicles (in lakhs) exp...

    Text Solution

    |

  10. The given Bar Graph presents Different Type of Vehicles (in lakhs) exp...

    Text Solution

    |

  11. The given Bar Graph presents Different Type of Vehicles (in lakhs) exp...

    Text Solution

    |

  12. The given Bar Graph presents Different Type of Vehicles (in lakhs) exp...

    Text Solution

    |

  13. The given Bar Graph presents the number of students enrolled for a voc...

    Text Solution

    |

  14. The given Bar Graph presents the number of students enrolled for a voc...

    Text Solution

    |

  15. What is the ratio of the total numbers of students enrolled in A durin...

    Text Solution

    |

  16. The given Bar Graph presents the number of students enrolled for vocat...

    Text Solution

    |

  17. The given Bar Graph presents Income and Expenditure (in crores of Rupe...

    Text Solution

    |

  18. The given Bar Graph presents Income and Expenditure (in crores of Rupe...

    Text Solution

    |

  19. The given Bar Graph presents Income and Expenditure (in crores of Rupe...

    Text Solution

    |

  20. The given Bar Graph presents Income and Expenditure (in crores of Rupe...

    Text Solution

    |