 The export of which type of vehicle in 2017 is approximately 18.3% more than the export of
same type of vehicle in 2016?
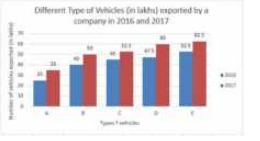
The export of which type of vehicle in 2017 is approximately 18.3% more than the export of
same type of vehicle in 2016? A
B
C
D
Text Solution
Verified by Experts


PINNACLE-DATA INTERPRETATION-EXERCISE
- The total production of motorcycles of companies B and D taken togethe...
Text Solution
|
- The given Bar graph presents the Demand and Production of motorcycles ...
Text Solution
|
- The given Bar Graph presents Different Type of Vehicles (in lakhs) exp...
Text Solution
|
- The given Bar Graph presents Different Type of Vehicles (in lakhs) exp...
Text Solution
|
- The given Bar Graph presents Different Type of Vehicles (in lakhs) exp...
Text Solution
|
- The given Bar Graph presents Different Type of Vehicles (in lakhs) exp...
Text Solution
|
- The given Bar Graph presents the number of students enrolled for a voc...
Text Solution
|
- The given Bar Graph presents the number of students enrolled for a voc...
Text Solution
|
- What is the ratio of the total numbers of students enrolled in A durin...
Text Solution
|
- The given Bar Graph presents the number of students enrolled for vocat...
Text Solution
|
- The given Bar Graph presents Income and Expenditure (in crores of Rupe...
Text Solution
|
- The given Bar Graph presents Income and Expenditure (in crores of Rupe...
Text Solution
|
- The given Bar Graph presents Income and Expenditure (in crores of Rupe...
Text Solution
|
- The given Bar Graph presents Income and Expenditure (in crores of Rupe...
Text Solution
|
- The given Bar Graph presents Income and Expenditure (in crores of Rupe...
Text Solution
|
- The given Bar Graph presents Income and Expenditure (in crores of Rupe...
Text Solution
|
- The total expenditure of the company from 2016 to 2018 is what percent...
Text Solution
|
- The given Bar Graph presents Income and Expenditure (in crores of Rupe...
Text Solution
|
- The given Bar Graph presents the results in terms of number of student...
Text Solution
|
- The given Bar Graph presents the results in terms of number of student...
Text Solution
|