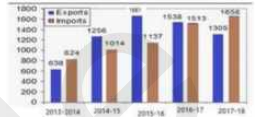
 In which financial year the total of the Exports and Imports is the lowest?
 A
B
C
D
Text Solution
Verified by Experts


PINNACLE-DATA INTERPRETATION-EXERCISE
- The given Bar Graph present the Imports and Exports of an item (in ton...
Text Solution
|
- The given Bar Graph presents the Imports and Exports of an item (in to...
Text Solution
|
- The given Bar Graph presents the Imports and Exports of an item (in to...
Text Solution
|
- In which financial year the absolute difference between the exports an...
Text Solution
|
- The given Bar Graph presents the Imports and Exports of an item (in to...
Text Solution
|
- The given Bar Graph presents the Imports and Exports of an item (in to...
Text Solution
|
- The given bar graph presents the Imports and Exports of an item manufa...
Text Solution
|
- The given Bar Graph presents the number of students of two schools for...
Text Solution
|
- What is the ratio of students taken for all years together from school...
Text Solution
|
- The given Bar Graph presents the number of students of two schools for...
Text Solution
|
- The given Bar Graph presents the number of students of two schools for...
Text Solution
|
- The given Bar Graph presents the number of students of two schools for...
Text Solution
|
- The given Bar Graph presents the number of students of two schools for...
Text Solution
|
- The given Bar Graph presents the number of students of two schools for...
Text Solution
|
- The given Bar Graph presents the number of students of two schools for...
Text Solution
|
- The given Bar Graph presents the number of students of two schools for...
Text Solution
|
- The given Bar Graph presents the number of students of two schools for...
Text Solution
|
- The given Bar Graph presents the number of students of two schools for...
Text Solution
|
- The given Bar Graph presents the number of students of two schools for...
Text Solution
|
- The given Bar Graph presents the results in terms of the number of stu...
Text Solution
|