A
B
C
D
Text Solution
Verified by Experts


Topper's Solved these Questions
Similar Questions
Explore conceptually related problems
PINNACLE-DATA INTERPRETATION-EXERCISE
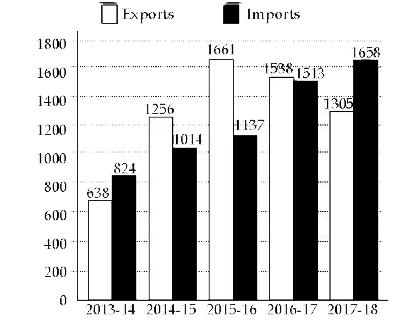
- The given Bar Graph presents the Imports and Exports of an item (in to...
Text Solution
|
- The given Bar Graph presents the Imports and Exports of an item (in to...
Text Solution
|
- The given bar graph presents the Imports and Exports of an item manufa...
Text Solution
|
- The given Bar Graph presents the number of students of two schools for...
Text Solution
|
- What is the ratio of students taken for all years together from school...
Text Solution
|
- The given Bar Graph presents the number of students of two schools for...
Text Solution
|
- The given Bar Graph presents the number of students of two schools for...
Text Solution
|
- The given Bar Graph presents the number of students of two schools for...
Text Solution
|
- The given Bar Graph presents the number of students of two schools for...
Text Solution
|
- The given Bar Graph presents the number of students of two schools for...
Text Solution
|
- The given Bar Graph presents the number of students of two schools for...
Text Solution
|
- The given Bar Graph presents the number of students of two schools for...
Text Solution
|
- The given Bar Graph presents the number of students of two schools for...
Text Solution
|
- The given Bar Graph presents the number of students of two schools for...
Text Solution
|
- The given Bar Graph presents the number of students of two schools for...
Text Solution
|
- The given Bar Graph presents the results in terms of the number of stu...
Text Solution
|
- The given Bar Graph presents the results in terms of the number of stu...
Text Solution
|
- The given Bar Graph presents the results in terms of the number of stu...
Text Solution
|
- The given Bar Graph presents the results in terms of the number of stu...
Text Solution
|
- The given Bar Graph presents the sales of the number of books (in thou...
Text Solution
|