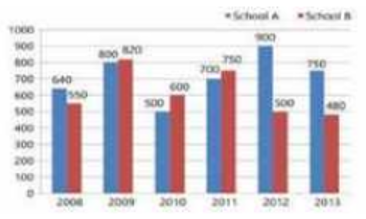
 What is the average number of students from school B during the six year period (correct to two
decimal places)?
What is the average number of students from school B during the six year period (correct to two
decimal places)? A
B
C
D
Text Solution
Verified by Experts
The correct Answer is:


PINNACLE-DATA INTERPRETATION-EXERCISE
- The given Bar Graph presents the number of students of two schools for...
Text Solution
|
- What is the ratio of students taken for all years together from school...
Text Solution
|
- The given Bar Graph presents the number of students of two schools for...
Text Solution
|
- The given Bar Graph presents the number of students of two schools for...
Text Solution
|
- The given Bar Graph presents the number of students of two schools for...
Text Solution
|
- The given Bar Graph presents the number of students of two schools for...
Text Solution
|
- The given Bar Graph presents the number of students of two schools for...
Text Solution
|
- The given Bar Graph presents the number of students of two schools for...
Text Solution
|
- The given Bar Graph presents the number of students of two schools for...
Text Solution
|
- The given Bar Graph presents the number of students of two schools for...
Text Solution
|
- The given Bar Graph presents the number of students of two schools for...
Text Solution
|
- The given Bar Graph presents the number of students of two schools for...
Text Solution
|
- The given Bar Graph presents the results in terms of the number of stu...
Text Solution
|
- The given Bar Graph presents the results in terms of the number of stu...
Text Solution
|
- The given Bar Graph presents the results in terms of the number of stu...
Text Solution
|
- The given Bar Graph presents the results in terms of the number of stu...
Text Solution
|
- The given Bar Graph presents the sales of the number of books (in thou...
Text Solution
|
- The given Bar Graph present the sales of the number of books (in thous...
Text Solution
|
- The given Bar Graph presents the sales of the number of books (in thou...
Text Solution
|
- The given Bar Graph present the sales of the number of books (in thous...
Text Solution
|