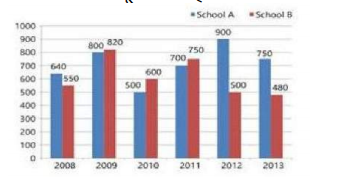
 What is the average (correct to two decimal places) of total students in schools A and B taken
together during the six year period?
What is the average (correct to two decimal places) of total students in schools A and B taken
together during the six year period? A
B
C
D
Text Solution
Verified by Experts
The correct Answer is:


PINNACLE-DATA INTERPRETATION-EXERCISE
- The given Bar Graph presents the number of students of two schools for...
Text Solution
|
- The given Bar Graph presents the number of students of two schools for...
Text Solution
|
- The given Bar Graph presents the number of students of two schools for...
Text Solution
|
- The given Bar Graph presents the number of students of two schools for...
Text Solution
|
- The given Bar Graph presents the number of students of two schools for...
Text Solution
|
- The given Bar Graph presents the number of students of two schools for...
Text Solution
|
- The given Bar Graph presents the results in terms of the number of stu...
Text Solution
|
- The given Bar Graph presents the results in terms of the number of stu...
Text Solution
|
- The given Bar Graph presents the results in terms of the number of stu...
Text Solution
|
- The given Bar Graph presents the results in terms of the number of stu...
Text Solution
|
- The given Bar Graph presents the sales of the number of books (in thou...
Text Solution
|
- The given Bar Graph present the sales of the number of books (in thous...
Text Solution
|
- The given Bar Graph presents the sales of the number of books (in thou...
Text Solution
|
- The given Bar Graph present the sales of the number of books (in thous...
Text Solution
|
- The given Bar Graph presents the sale (in 1000 kg) of a particular bra...
Text Solution
|
- The given Bar Graph presents the sale (in 1000 kg) of a particular bra...
Text Solution
|
- The given Bar Graph presents the sale (in 1000 kg) of a particular bra...
Text Solution
|
- The given Bar Graph presents the sale (in 1000 kg) of a particular bra...
Text Solution
|
- The given bar graph presents the runs scored and strike rate of a bats...
Text Solution
|
- The given Bar Graph presents the runs scored (A) and strike rate (B) o...
Text Solution
|