Home
Class 14
MATHS
The given Bar Graph presents the results...

The given Bar Graph presents the results in terms of the number of students in a school for the five academic years, 2013-2014 to 2017-2018.
दिया गया दंड आरेख पांच शैक्षणिक वर्षों : 2013-2014 से 2017-2018 तक एक विद्यालय में छात्रों की संख्या के संदर्भ में परिणामों को प्रस्तुत करता है |
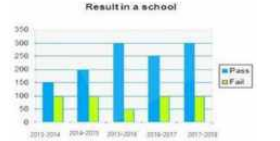
In which academic year the difference between the number of students passed and that of those failed is the lowest?
किस शैक्षणिक वर्ष में, पास करने वाले छात्रों तथा फेल करने वाले छात्रों की संख्या में सबसे कम अंतर है ?

A

2013-2014

B

2014-2015

C

2016-2017

D

2015-2016

Text Solution

Verified by Experts

Promotional Banner

Topper's Solved these Questions

Similar Questions

Explore conceptually related problems

The given Bar Graph presents the results in terms of the number of students in a school for the five academic years, 2013-2014 to 2017-2018. दिया गया दंड आरेख पांच शैक्षणिक वर्षों : 2013-2014 से 2017-2018 तक एक विद्यालय में छात्रों की संख्या के संदर्भ में परिणामों को प्रस्तुत करता है | What is the average number of students who passed in the five academic years? पांच शैक्षणिक वर्षों में पास करने वाले छात्रों की औसत संख्या कया है ?

The given Bar Graph presents the results in terms of number of students for the five academic years, 2013-2014 to 2017-2018. दिया गया दंड आरेख पांच शैक्षणिक वर्षों : 2013-2014 से 2017-2018 तक छात्रों की संख्या के संदर्भ में परिणामों को प्रस्तुत करता है | The difference between the number of students passed and those who failed is the highest in which academic year? किस शैक्षणिक वर्ष में पास करने वाले तथा फेल करने वाले छात्रों की संख्या में सर्वाधिक अंतर है ?

The given Bar Graph presents the results in terms of the number of students in a school for the five academic years, 2013-2014 to 2017-2018. दिया गया दंड आरेख (बार ग्राफ) पाँच शैक्षणिक वर्षों , 2013-2014 से 2017-2018 तक, के दौरान एक स्कूल के परीक्षाफल के संदर्भ में विधाथ्थियों की संख्या को दर्शाता है। In which academic year the difference between the number of students passed and and that of those failed is the lowest? किस शैक्षणिक वर्ष में उत्तीर्ण और अनुत्तीर्ण विद्यार्थियों की संख्या के बीच का अंतर सबसे कम है?

The given Bar Graph presents the results in terms of the number of students in a school for the five academic years, 2013-2014 to 2017-2018. दिया गया दंड आरेख पांच शैक्षणिक वर्षों : 2013-2014 से 2017-2018 तक एक विद्यालय में छात्रों की संख्या के संदर्भ में परिणामों को प्रस्तुत करता है | What is the approximate percentage (Correct to nearest integer) of the students who failed during the five academic years taken together? पांच शैक्षणिक वर्षों को मिलाकर उन छात्रों का लगभग प्रतिशत ( निकटतम पूर्णाक में ) ज्ञात करें जो फेल हुए हैं ?

The given Bar Graph presents the results in terms of number of students for the five academic years, 2013-2014 to 2017-2018. दिया गया दंड आरेख पांच शैक्षणिक वर्षों : 2013-2014 से 2017-2018 तक छात्रों की संख्या के संदर्भ में परिणामों को प्रस्तुत करता है | What is the average of failed students in five academic years? पांच शैक्षणिक वर्षों में असफल छात्रों का औसत कया है ?

The given Bar Graph presents the results in terms of number of students for the five academic years, 2013-2014 to 2017-2018. दिया गया दंड आरेख पांच शैक्षणिक वर्षों : 2013-2014 से 2017-2018 तक छात्रों की संख्या के संदर्भ में परिणामों को प्रस्तुत करता है | In which year the percentage increase in the total number of students is the highest in comparison to the previous academic year? किस वर्ष कुल छात्रों की संख्या में प्रतिशत वृद्धि पिछले शैक्षणिक वर्ष की तुलना में सर्वाधिक है ?

The given Bar Graph presents the results in terms of number of students for the five academic years, 2013-2014 to 2017-2018. दिया गया दंड आरेख पांच शैक्षणिक वर्षों : 2013-2014 से 2017-2018 तक छात्रों की संख्या के संदर्भ में परिणामों को प्रस्तुत करता है | What is the approximate percentage of students passed during five academic years (correct to the nearest integer)? पांच शैक्षणिक वर्षों के दौरान पास करने वाले छात्रों का प्रतिशत ( लगभग ) कितना है ? ( निकटतम पूर्णाक में )

The given Bar Graph presents the results in terms of the number of students in a school for the five academic years, 2013-2014 to 2017-2018. दिया गया दंड आरेख (बार ग्राफ) पाँच शैक्षणिक वर्षों , 2013-2014 से 2017-2018 तक, के दौरान एक स्कूल के परीक्षाफल के संदर्भ में विधाथ्थियों की संख्या को दर्शाता है। What is the average number of students who passed in the five academic years? पाँच शैक्षणिक वर्षो में उत्तीर्ण होने वाले विद्यार्थियों की संख्या क्या है।

The given bar graph presents the results in terms of number of students in a school for the 5 academic years, 2013-2014 to 2017-2018. दिया गया दंड आरेख ( बार ग्राफ) 5 शैक्षणिक वर्षो, 2013-2014 से 2017-2018, के दौरान किसी स्कूल के परीक्षाफल को विद्यार्थियों की संख्या के रूप में दर्शाता है| The difference between the number of students passed and those who failed is the highest in which academic year? उत्तीर्ण छात्रों की संख्या और अनुन्तीर्ण होने वालों के बीच का अंतर किस शैक्षणिक वर्ष में सबसे अधिक है?

The given Bar Graph presents the results in terms of the number of students in a school for the five academic years, 2013-2014 to 2017-2018. What is the average number of students who passed in the five academic years?

PINNACLE-DATA INTERPRETATION-EXERCISE
  1. The given Bar Graph presents the number of students of two schools for...

    Text Solution

    |

  2. The given Bar Graph presents the results in terms of the number of stu...

    Text Solution

    |

  3. The given Bar Graph presents the results in terms of the number of stu...

    Text Solution

    |

  4. The given Bar Graph presents the results in terms of the number of stu...

    Text Solution

    |

  5. The given Bar Graph presents the results in terms of the number of stu...

    Text Solution

    |

  6. The given Bar Graph presents the sales of the number of books (in thou...

    Text Solution

    |

  7. The given Bar Graph present the sales of the number of books (in thous...

    Text Solution

    |

  8. The given Bar Graph presents the sales of the number of books (in thou...

    Text Solution

    |

  9. The given Bar Graph present the sales of the number of books (in thous...

    Text Solution

    |

  10. The given Bar Graph presents the sale (in 1000 kg) of a particular bra...

    Text Solution

    |

  11. The given Bar Graph presents the sale (in 1000 kg) of a particular bra...

    Text Solution

    |

  12. The given Bar Graph presents the sale (in 1000 kg) of a particular bra...

    Text Solution

    |

  13. The given Bar Graph presents the sale (in 1000 kg) of a particular bra...

    Text Solution

    |

  14. The given bar graph presents the runs scored and strike rate of a bats...

    Text Solution

    |

  15. The given Bar Graph presents the runs scored (A) and strike rate (B) o...

    Text Solution

    |

  16. The given Bar Graph presents the runs scored (A) and strike rate (B) o...

    Text Solution

    |

  17. The given Bar Graph presents the runs scored (A) and strike rate (B) o...

    Text Solution

    |

  18. A book has been co-authored by X and Y. The prices of the book in Indi...

    Text Solution

    |

  19. The given Bar Graph presents the data of annual income (A) and annual ...

    Text Solution

    |

  20. The given Bar Graph presents the data of annual income (A) and annual ...

    Text Solution

    |