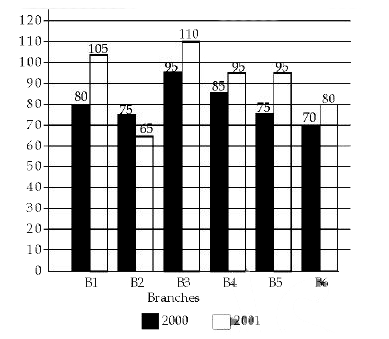
 The ratio of total sales by all branches for the year 2001 to total sales by all branches for the year 2000 is:
 A
B
C
D
Text Solution
Verified by Experts
The correct Answer is:


PINNACLE-DATA INTERPRETATION-EXERCISE
- The given Bar Graph presents the results in terms of the number of stu...
Text Solution
|
- The given Bar Graph presents the results in terms of the number of stu...
Text Solution
|
- The given Bar Graph presents the sales of the number of books (in thou...
Text Solution
|
- The given Bar Graph present the sales of the number of books (in thous...
Text Solution
|
- The given Bar Graph presents the sales of the number of books (in thou...
Text Solution
|
- The given Bar Graph present the sales of the number of books (in thous...
Text Solution
|
- The given Bar Graph presents the sale (in 1000 kg) of a particular bra...
Text Solution
|
- The given Bar Graph presents the sale (in 1000 kg) of a particular bra...
Text Solution
|
- The given Bar Graph presents the sale (in 1000 kg) of a particular bra...
Text Solution
|
- The given Bar Graph presents the sale (in 1000 kg) of a particular bra...
Text Solution
|
- The given bar graph presents the runs scored and strike rate of a bats...
Text Solution
|
- The given Bar Graph presents the runs scored (A) and strike rate (B) o...
Text Solution
|
- The given Bar Graph presents the runs scored (A) and strike rate (B) o...
Text Solution
|
- The given Bar Graph presents the runs scored (A) and strike rate (B) o...
Text Solution
|
- A book has been co-authored by X and Y. The prices of the book in Indi...
Text Solution
|
- The given Bar Graph presents the data of annual income (A) and annual ...
Text Solution
|
- The given Bar Graph presents the data of annual income (A) and annual ...
Text Solution
|
- The given Bar Graph presents the data of annual income (A) and annual ...
Text Solution
|
- The given Bar Graph presents the data of annual income (A) and annual ...
Text Solution
|
- The full marks for a paper is 300. The breakup of the marks into theor...
Text Solution
|