Home
Class 14
MATHS
The given Bar Graph present the sales of...

The given Bar Graph present the sales of the number of books (in thousands) by six branches of a publishing company during two consecutive years 2000 and 2001.
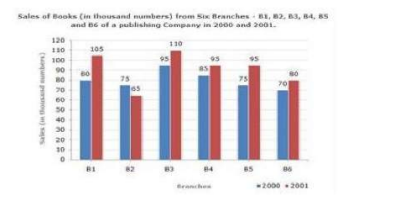
The total sales (in thousands) by all branches for both years is:

A

470

B

560

C

1100

D

1030

Text Solution

Verified by Experts

Promotional Banner

Topper's Solved these Questions

Similar Questions

Explore conceptually related problems

The given Bar Graph present the sales of the number of books (in thousands) by six branches of a publishing company during two consecutive years 2000 and 2001. The ratio of the sales by all branches for the year 2001 to total sales by all branches for the year 2000 is:

The given Bar Graph present the sales of the number of books (in thousands) by six branches of a publishing company during two consecutive years 2000 and 2001. The average of total sales (in thousands and correct to decimal places)by all branches for both the years is:

The given bar graph present the sales of the number of books by six branches of a publishing company during two consecutive years 2000 and 2001. The ratio of total sales by all branches for the year 2001 to total sales by all branches for the year 2000 is:

The given Bar Graph present the sales of the number of books (in thousands) by six branches of a publishing company during two consecutive years 2000 and 2001. दिया गया दंड आरेख (बार ग्राफ़ ) लगातार दो वर्षों 2000 और 2001 के दौरान किसी प्रकाशन कंपनी की छह शाखाओं द्वारा पुस्तकों की बिक्री की संख्या ( हजार में ) को दर्शाता है| The ratio of total sales by branches B1, B3 and B5 for both the years to total sales by branches B2, B4, B6 for both the years is: दोनों वर्षों के लिए B1, B3 और B5 तथा B2, B4 और B6द्वारा कुल बिक्री का अनुपात होगा:

The given Bar Graph presents the sales of the number of books (in thousands) by six benches of a publishing company during two consecutive years 2000 and 2001. दिया गया दंड आरेख लगातार दो वर्षों : 2000 और 2001 में एक प्रकाशन कंपनी की छः शाखाओं के द्वारा बेची गयी पुस्तकों की संख्या ( हज़ार में ) दर्शाता है | The ratio of total sales by all branches for the year 2001 to total sales by all branches for the year 2000 is: वर्ष 2001 में सभी शाखाओं की कुल बिक्री का वर्ष 2000 में सभी शाखाओं की कुल बिक्री के साथ अनुपात ज्ञात करें|

The given Bar Graph presents the sales of the number of books (in thousands) by six benches of a publishing company during two consecutive years 2000 and 2001. दिया गया दंड आरेख लगातार दो वर्षों : 2000 और 2001 में एक प्रकाशन कंपनी की छः शाखाओं के द्वारा बेची गयी पुस्तकों की संख्या ( हज़ार में ) दर्शाता है | The ratio of total sales by branches B1, B3 and B5 for both the years to total sales by branches B2, B4, B6 for both the years is: दोनों वर्षों में शाखाओं B1, B3 और B5 की कुल बिक्री तथा शाखाओं B2, B4 और B6 की कुल बिक्री के बीच अनुपात ज्ञात करें |

The given bar chart, shows the sales of books (in thousand number) from six branches of a publishing company during two consecutive years 2000 and 2001. In the given bar-chart, the ratio of total sales of all branches (in thousand numbers) for the year 2000 to 2001 is:

The given bar chart shows the sales of books from six branches of a publishing company during two consecutive years 2000 and 2001. In the given bar chart, the ratio of total sales of all branches for the year 2000 to 2001 is:

PINNACLE-DATA INTERPRETATION-EXERCISE
  1. The given Bar Graph present the sales of the number of books (in thous...

    Text Solution

    |

  2. The given Bar Graph presents the sales of the number of books (in thou...

    Text Solution

    |

  3. The given Bar Graph present the sales of the number of books (in thous...

    Text Solution

    |

  4. The given Bar Graph presents the sale (in 1000 kg) of a particular bra...

    Text Solution

    |

  5. The given Bar Graph presents the sale (in 1000 kg) of a particular bra...

    Text Solution

    |

  6. The given Bar Graph presents the sale (in 1000 kg) of a particular bra...

    Text Solution

    |

  7. The given Bar Graph presents the sale (in 1000 kg) of a particular bra...

    Text Solution

    |

  8. The given bar graph presents the runs scored and strike rate of a bats...

    Text Solution

    |

  9. The given Bar Graph presents the runs scored (A) and strike rate (B) o...

    Text Solution

    |

  10. The given Bar Graph presents the runs scored (A) and strike rate (B) o...

    Text Solution

    |

  11. The given Bar Graph presents the runs scored (A) and strike rate (B) o...

    Text Solution

    |

  12. A book has been co-authored by X and Y. The prices of the book in Indi...

    Text Solution

    |

  13. The given Bar Graph presents the data of annual income (A) and annual ...

    Text Solution

    |

  14. The given Bar Graph presents the data of annual income (A) and annual ...

    Text Solution

    |

  15. The given Bar Graph presents the data of annual income (A) and annual ...

    Text Solution

    |

  16. The given Bar Graph presents the data of annual income (A) and annual ...

    Text Solution

    |

  17. The full marks for a paper is 300. The breakup of the marks into theor...

    Text Solution

    |

  18. The full marks for a paper is 300. The break-up of the marks into theo...

    Text Solution

    |

  19. The full marks for a paper is 300. The break-up of the marks into theo...

    Text Solution

    |

  20. The full marks for a paper is 300. The break-up of the marks into theo...

    Text Solution

    |