 By how much
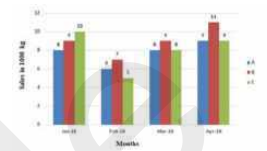
 quantity is the average sale per month from B more or less than that from C?
By how much
By how much quantity is the average sale per month from B more or less than that from C?
A
B
C
D
Text Solution
Verified by Experts


Topper's Solved these Questions
Similar Questions
Explore conceptually related problems
PINNACLE-DATA INTERPRETATION-EXERCISE
- The given Bar Graph presents the sale (in 1000 kg) of a particular bra...
Text Solution
|
- The given Bar Graph presents the sale (in 1000 kg) of a particular bra...
Text Solution
|
- The given Bar Graph presents the sale (in 1000 kg) of a particular bra...
Text Solution
|
- The given Bar Graph presents the sale (in 1000 kg) of a particular bra...
Text Solution
|
- The given bar graph presents the runs scored and strike rate of a bats...
Text Solution
|
- The given Bar Graph presents the runs scored (A) and strike rate (B) o...
Text Solution
|
- The given Bar Graph presents the runs scored (A) and strike rate (B) o...
Text Solution
|
- The given Bar Graph presents the runs scored (A) and strike rate (B) o...
Text Solution
|
- A book has been co-authored by X and Y. The prices of the book in Indi...
Text Solution
|
- The given Bar Graph presents the data of annual income (A) and annual ...
Text Solution
|
- The given Bar Graph presents the data of annual income (A) and annual ...
Text Solution
|
- The given Bar Graph presents the data of annual income (A) and annual ...
Text Solution
|
- The given Bar Graph presents the data of annual income (A) and annual ...
Text Solution
|
- The full marks for a paper is 300. The breakup of the marks into theor...
Text Solution
|
- The full marks for a paper is 300. The break-up of the marks into theo...
Text Solution
|
- The full marks for a paper is 300. The break-up of the marks into theo...
Text Solution
|
- The full marks for a paper is 300. The break-up of the marks into theo...
Text Solution
|
- The given bar graph presents the sales of a particular brand of car by...
Text Solution
|
- What was the average number of cars sold by A during Feb-Apr 2016
Text Solution
|
- The given bar graph present the sale of a particular brand of tea by ...
Text Solution
|