A
B
C
D
Text Solution
Verified by Experts


PINNACLE-DATA INTERPRETATION-EXERCISE
- The full marks for a paper is 300. The break-up of the marks into theo...
Text Solution
|
- The full marks for a paper is 300. The break-up of the marks into theo...
Text Solution
|
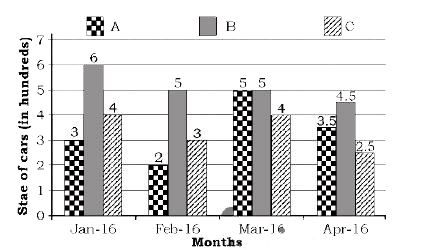
- The given bar graph presents the sales of a particular brand of car by...
Text Solution
|
- What was the average number of cars sold by A during Feb-Apr 2016
Text Solution
|
- The given bar graph present the sale of a particular brand of tea by ...
Text Solution
|
- IF the cars sold by A and B are all found to be in perfect order, but ...
Text Solution
|
- The given bar graph presents the percentages of population in the age ...
Text Solution
|
- The given Bar Graph presents the percentages of population in the age ...
Text Solution
|
- The given Bar Graph presents the percentages of population in the age ...
Text Solution
|
- What is the ratio of total number of persons of ages above 50 years in...
Text Solution
|
- In th given histogram, the number of students whose height is the clas...
Text Solution
|
- In the given histogram, which class is the median classs?
Text Solution
|
- In the given bar graph, the percentage decrease in the number of stude...
Text Solution
|
- In the given histogram what is the percentage of students whose height...
Text Solution
|
- In the given bar graph, what is the ratio of students of A and B in t...
Text Solution
|
- In the given pie chart the number of persons using a car is what perce...
Text Solution
|
- In the given bar graph, the number of students enrolled in institute b...
Text Solution
|
- In the given pie chart what is the ratio of the total number of person...
Text Solution
|
- In the given pie chart how many persons are using train to reach their...
Text Solution
|
- In the given bar graph, in which college the percentage of boys is the...
Text Solution
|