Home
Class 14
MATHS
The given Bar Graph presents the percent...

The given Bar Graph presents the percentages of population in the age groups. X(above 50 years), Y(20 to 50 years). Z(below 20 years) in five different villages. A,B,C,D and E with total population of 5000, 6000, 8000, 4500 and 6000 respectively
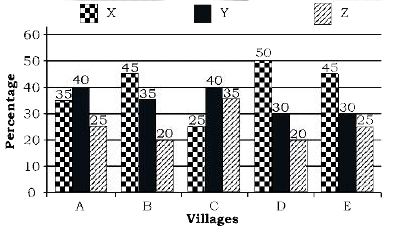
The difference between the number of persons of ages below 20 years in villages D and E,taken together, is what percentage of the number of persons of the same age group in village D?

A

`190/3`

B

`185/3`

C

`182/3`

D

`200/3`

Text Solution

Verified by Experts

The correct Answer is:
D
Promotional Banner

Topper's Solved these Questions

Similar Questions

Explore conceptually related problems

The given bar graph presents the percentages of population in the age groups X ,Y , Z in five different villages A,B,C,D and E total population of 5000,6000,8000,4500 and 6000 respectively. The number of persons having ages below 20 years in villages B and C taken together is what percentage of the total population of the said villages.

The given Bar Graph presents the percentages of population in the age groups. X(above 50 years), Y(20 to 50 years). Z(below 20 years) in five different villages. A,B,C,D and E with total population of 5000, 6000, 8000, 4500 and 6000 respectively दिया गया दंड आरेख पांच गाँवों - A, B, C, D और E, जिनकी कुल आबादी क्रमशः 5000, 6000, 8000, 4500 और 6000 है, वहां आबादी के प्रतिशत को आयु वर्गों में प्रस्तुत करता है : X (50 वर्ष से अधिक ), Y (20 से 50 वर्ष ), Z (20 वर्ष से कम ) What is the ratio of the total number of persons of ages above 50 years in the villages, B and C, taken together to the total number of persons having ages between 20 and 50 years in the said villages? B और C गाँवों को मिलाकर 50 वर्ष से अधिक उम्र वाले व्यक्तियों की कुल संख्या का इन गाँवों में 20 से 50 वर्ष की आयु के व्यक्तियों की कुल संख्या के साथ अनुपात ज्ञात करें |

The given Bar Graph presents the percentages of population in the age groups. X(above 50 years), Y(20 to 50 years). Z(below 20 years) in five different villages. A,B,C,D and E with total population of 5000, 6000, 8000, 4500 and 6000 respectively दिया गया दंड आरेख पांच गाँवों - A, B, C, D और E, जिनकी कुल आबादी क्रमशः 5000, 6000, 8000, 4500 और 6000 है, वहां आबादी के प्रतिशत को आयु वर्गों में प्रस्तुत करता है : X (50 वर्ष से अधिक ), Y (20 से 50 वर्ष ), Z (20 वर्ष से कम ) what is the total number of persons in the age group of 20 to 50 years in the villages A and B, taken together? गाँव A तथा B को मिलाकर 20 से 50 वर्ष के आयु वर्ग में लोगों की संख्या कुल कितनी है ?

The difference between the ages of two persons is 10 years. 15 years ago the elder one was twice as old as the younger one. The present age of the elder person is

A table showing the percentage of the total population of a State by age groups for the year 1991 is given below. Answer the questions given below it. If there are 10 millions people in the age group 56 years and above, what is the difference between the numbers of people in the age groups 16-25 and 46-55?

PINNACLE-DATA INTERPRETATION-EXERCISE
  1. The given bar graph presents the percentages of population in the age ...

    Text Solution

    |

  2. The given Bar Graph presents the percentages of population in the age ...

    Text Solution

    |

  3. The given Bar Graph presents the percentages of population in the age ...

    Text Solution

    |

  4. What is the ratio of total number of persons of ages above 50 years in...

    Text Solution

    |

  5. In th given histogram, the number of students whose height is the clas...

    Text Solution

    |

  6. In the given histogram, which class is the median classs?

    Text Solution

    |

  7. In the given bar graph, the percentage decrease in the number of stude...

    Text Solution

    |

  8. In the given histogram what is the percentage of students whose height...

    Text Solution

    |

  9. In the given bar graph, what is the ratio of students of A and B in t...

    Text Solution

    |

  10. In the given pie chart the number of persons using a car is what perce...

    Text Solution

    |

  11. In the given bar graph, the number of students enrolled in institute b...

    Text Solution

    |

  12. In the given pie chart what is the ratio of the total number of person...

    Text Solution

    |

  13. In the given pie chart how many persons are using train to reach their...

    Text Solution

    |

  14. In the given bar graph, in which college the percentage of boys is the...

    Text Solution

    |

  15. In the given histogram, what is the mean speed of cars to nearest whol...

    Text Solution

    |

  16. In the given bar graph what is the ratio of the total boys and girls i...

    Text Solution

    |

  17. In the given pie-chart, if the female employees in department D is 75%...

    Text Solution

    |

  18. In the given bar graph, what is the average number of girls from all s...

    Text Solution

    |

  19. Label A,B,C and D in the given diagram.

    Text Solution

    |

  20. In the given pie chart what is the central angle of the sector represe...

    Text Solution

    |