Home
Class 14
MATHS
In the given histogram what percentage o...

In the given histogram what percentage of cars were running with the speed less than 60km/h

A

0.3

B

0.35

C

0.25

D

0.28

Text Solution

Verified by Experts

Promotional Banner

Topper's Solved these Questions

Similar Questions

Explore conceptually related problems

The given histogram shows the frequency distribution of the speed of cars passing though at a particular spot on a highway. Study the graph and answer the question that follows. What percentage of cars were running with speed less than 70 km/h?

The given histogram shows the frequency distribution of the speed of cars passing through a particular spot on a highway. Read the graph and answer the following question. What percentage of cars were running with the speed of 90 km/h and above?

In the given histogram, what percentage of students got marks less than 45?

In the given histogram, what is the mean speed of cars to nearest whole number ?

The given histogram shows the frequency distribution of the speed of cars passing through a particular spot on a highway. Read the graph and answer the following question. What is the ratio of the number of cars with speed less than 60 km h to the number of cars with speed more than 70 km/h?

The given histogram shows the frequency distribution of the speed of cars passing though at a particular spot on a highway. Study the graph and answer the question that follows. What is the ratio of the number of cars with speed less than 60 km/h to the number of cars with speed more than 80 km/h?

The given histogram shows the frequency distribution of the speed of cars passing though at a particular spot on a highway. Study the graph and answer the question that follows The number of cars with speed between 70km/h and 80km/h is what percentage more than the number of the cars with speed between 50 km/h and 60 kmh ? (correct to one decimal place)

The given histogram shows the frequency distribution of the speed of cars passing through a particular spot on a lighway. Read the graph and answer the following question. The number of cars with speed (km/h) in the interval (60 - 70) km/h is what percentage less than the number of cars with speed (km/h) in the interval (70-80) km/h? (correct to one decimal place)

What amount is 20% less than ₹60?

A car is moving on a straight road covers one third of the distance with a speed of 20 km/h and the rest with a speed of 60 km/h. The average speed of the car is

PINNACLE-DATA INTERPRETATION-EXERCISE
  1. Label A,B,C and D in the given diagram.

    Text Solution

    |

  2. In the given pie chart what is the central angle of the sector represe...

    Text Solution

    |

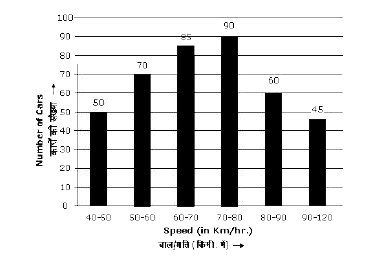
  3. In the given histogram what percentage of cars were running with the s...

    Text Solution

    |

  4. In the given histogram, in which class interval the median lies

    Text Solution

    |

  5. In the given pie chart what is the total expenditure (in percent) on l...

    Text Solution

    |

  6. In the given bar graph, in which college the difference between the pe...

    Text Solution

    |

  7. In the given histogram,what is the mean height of all students correct...

    Text Solution

    |

  8. In the given bar graph what is the average number of girls in all coll...

    Text Solution

    |

  9. In the given histogram what percentage of students have height in the ...

    Text Solution

    |

  10. In the given pie chart the expenditure on steel is what percent of the...

    Text Solution

    |

  11. In the given histogram, in which class notes the median height of the ...

    Text Solution

    |

  12. In the given pie chart what is the ratio of the total expenditure on s...

    Text Solution

    |

  13. In the given pie chart, the amount spend on education is what percent ...

    Text Solution

    |

  14. In the given bar graph, what is the average number of females in all f...

    Text Solution

    |

  15. In the given bar graph, what is the ratio of the total males and femal...

    Text Solution

    |

  16. In the given histogram, what percentage of students got marks less tha...

    Text Solution

    |

  17. In the given pie chart total expenditure together on rent and educatio...

    Text Solution

    |

  18. In the given histogram, in which class interval the median lies

    Text Solution

    |

  19. In the given bar graph, in which organisation, the percentage differen...

    Text Solution

    |

  20. In the given histogram, what is the mean marks of the students, correc...

    Text Solution

    |