Home
Class 14
MATHS
In the given histogram, what is the mean...

In the given histogram, what is the mean marks of the students, correct to one decimal place?
दिए गए आयतचित्र के अनुसार एक दशमलव स्थान तक छात्रों का माध्य अंक क्या है ?

A

51.2

B

53.5

C

52.7

D

50.6

Text Solution

Verified by Experts

The correct Answer is:
D
Promotional Banner

Topper's Solved these Questions

Similar Questions

Explore conceptually related problems

In the given histogram,what is the mean height of all students correct to one decimal place? / दिए गए आयतचित्र में, एक दशमलव स्थान तक सभी छात्रों की औसत लंबाई क्या है?

In the given histogram, what is the mean height of all students to one decimal place.

As per the data shown in the following table, what is the percentage of students who got less than 50 marks? निम्नलिखित तालिका में दिए गए आंकड़ों के अनुसार, उन छात्रों का प्रतिशत क्या है जिन्हें 50 अंक से कम अंक आए हैं ?

The bar graph given below presents the marks (out of 100) obtained by 10 students in a subject. यह दंड आरेख एक विषय में 10 छात्रों के प्राप्तांक ( 100 में से ) को दर्शाता है | The marks obtained by S5 is how much percent more than the average marks of the students (correct to two decimal)? S5 का प्राप्तांक छात्रों के औसत अंक से कितना प्रतिशत अधिक है ?

As per the data in the table, what is the percentage of students who got 20 or more marks? दी गयी तालिका के आंकड़ों के अनुसार, 20 या अधिक अंक प्राप्त हे वाले छात्रों का प्रतिशत कितना है ?

The marks obtained by various students have been shown in the data given below. नीचे दिए गए आंकड़े विभिन्न छात्रों द्वारा प्राप्त अंको को दर्शाया गया है What is the mean marks ( correct to two decimal places ) of the given data ? दिए गए आंकड़े का माध्य अंक (दो दशमलव स्थान तक ) कितना है

Study the given histogram that shows the marks obtained by students in an examination and answer the question that follows: दिए गए हिस्टोग्राम का अध्ययन करें जो एक परीक्षा में छात्रों द्वारा प्राप्त किए गए अंकों को दिखाता है और निम्न प्रश्न का उत्तर दे| If the total marks obtained by students be represented as a pie chart, then the central angle of thesector representing marks 200 or more but less than 300, is :(correct to one decimal place) यदि छात्रों द्वारा प्राप्त कुल अंकों को पाई चार्ट के रूप में दर्शाया जाता है, तो 200 या अधिक और 300 से कम अंकों का प्रतिनिधित्व करने वाले क्षेत्र का केंद्रीय कोण है: (एक दशमलव स्थान के लिए सही)

Study the given histogram that shows the marks obtained by students in an examination and answer the question that follows: दिए गए हिस्टोग्राम का अध्ययन करें जो एक परीक्षा में छात्रों द्वारा प्राप्त किए गए अंकों को दिखाता है और निम्न प्रश्न का उत्तर दे| The number of students who obtained less than 200 marks is: 200 से कम अंक प्राप्त करने वाले छात्रों की संख्या है:

What is the average of first seven prime numbers (correct to two decimal places)? पहली सात अभाज्य संख्याओं का औसत ज्ञात करें | ( दो दशमलव स्थान तक )

The average of twenty-five numbers is 54. The average of the first 13 numbers and that of the last 13 numbers is 52.8 and 62.2, respectively. If the 13^(th) number is excluded, then what is the average of the remaining numbers(correct to one decimal place)? पच्चीस की संख्या का औसत 54 है। पहली 13 संख्याओं का औसत और अंतिम 13 संख्याओं का औसत क्रमशः 52.8 और 62.2 है। यदि 13 ^ (वें) संख्या को बाहर रखा गया है, तो शेष संख्याओं का औसत (एक दशमलव स्थान के लिए सही) क्या है?

PINNACLE-DATA INTERPRETATION-EXERCISE
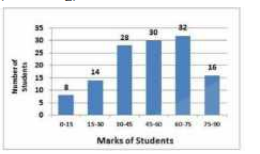
  1. In the given histogram, in which class interval the median lies

    Text Solution

    |

  2. In the given bar graph, in which organisation, the percentage differen...

    Text Solution

    |

  3. In the given histogram, what is the mean marks of the students, correc...

    Text Solution

    |

  4. In the given pie chart what is the total expenditure on rent

    Text Solution

    |

  5. The given pie-chart depicts the percentage of students coming to schoo...

    Text Solution

    |

  6. The given pie-chart depicts the percentage of students coming to schoo...

    Text Solution

    |

  7. The line graph shows electricity consumption for three households A, B...

    Text Solution

    |

  8. The line graph shows electricity consumption for three households A, B...

    Text Solution

    |

  9. The given pie-chart depicts the percentage of students coming to schoo...

    Text Solution

    |

  10. The line graph shows electricity consumption for three households A,B ...

    Text Solution

    |

  11. The given bar chart, shows the sales of books ( in thousand number) fr...

    Text Solution

    |

  12. The given bar chart shows the sales of books from six branches of a pu...

    Text Solution

    |

  13. The given pie-chart, shows the percentage distribution of the expendit...

    Text Solution

    |

  14. The given bar chart shows the sales of books from six branches of a pu...

    Text Solution

    |

  15. The given pie chart shows the percentage distribution of the expenditu...

    Text Solution

    |

  16. The given pie chart shows the percentage distribution of the expenditu...

    Text Solution

    |

  17. The given bar chart shows production of steel by companies A , B , C a...

    Text Solution

    |

  18. The given bar chart production of steel by companies A , B, c and D fo...

    Text Solution

    |

  19. The given bar chart shows production of steel by companies A , B , C a...

    Text Solution

    |

  20. The given pie-chart favourite sport of students of a school. दिया गय...

    Text Solution

    |