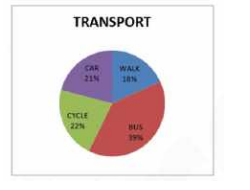
 In the given pie-chart, the difference between the number of students travel by bus or walk to the number of students travel by car or cycle,
 A
B
C
D
Text Solution
Verified by Experts


PINNACLE-DATA INTERPRETATION-EXERCISE
- In the given pie chart what is the total expenditure on rent
Text Solution
|
- The given pie-chart depicts the percentage of students coming to schoo...
Text Solution
|
- The given pie-chart depicts the percentage of students coming to schoo...
Text Solution
|
- The line graph shows electricity consumption for three households A, B...
Text Solution
|
- The line graph shows electricity consumption for three households A, B...
Text Solution
|
- The given pie-chart depicts the percentage of students coming to schoo...
Text Solution
|
- The line graph shows electricity consumption for three households A,B ...
Text Solution
|
- The given bar chart, shows the sales of books ( in thousand number) fr...
Text Solution
|
- The given bar chart shows the sales of books from six branches of a pu...
Text Solution
|
- The given pie-chart, shows the percentage distribution of the expendit...
Text Solution
|
- The given bar chart shows the sales of books from six branches of a pu...
Text Solution
|
- The given pie chart shows the percentage distribution of the expenditu...
Text Solution
|
- The given pie chart shows the percentage distribution of the expenditu...
Text Solution
|
- The given bar chart shows production of steel by companies A , B , C a...
Text Solution
|
- The given bar chart production of steel by companies A , B, c and D fo...
Text Solution
|
- The given bar chart shows production of steel by companies A , B , C a...
Text Solution
|
- The given pie-chart favourite sport of students of a school. दिया गय...
Text Solution
|
- The given bar chart shows the sales for sets of television of three co...
Text Solution
|
- The table below shows the admission and transfer in standards 1-3 of a...
Text Solution
|
- The given bar chart shows the sales for sets of television of three co...
Text Solution
|