Home
Class 14
MATHS
The given pie chart shows the expenditur...

The given pie chart shows the expenditure given in millions on each game.
दिया गया पाई चार्ट प्रत्येक खेल पर करोड़ो में दिए गए व्यय को दर्शाता है |
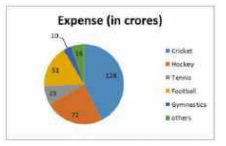
In the given pie chart, what is the difference between expenditure on cricket and football ?
दिए गए पाई चार्ट में , क्रिकेट और फुटबॉल पर किये गए व्यय के बीच क्या अंतर है ?

A

21

B

49

C

56

D

77

Text Solution

Verified by Experts

Promotional Banner

Topper's Solved these Questions

Similar Questions

Explore conceptually related problems

The given pie-chart favourite sport of students of a school. दिया गया पाई चार्ट एक विद्यालय के छात्रों के पसंदीदा खेल को दर्शाता है | In the given pie-chart, what is the difference in percentage between liking for football and basketball? इस पाई चार्ट के अनुसार, फुटबॉल तथा बास्केटबॉल पसंद करने के प्रतिशत में क्या अंतर है ?

The given pie chart shows runs scored by A in 6 matches. दिया गया पाई चार्ट A के द्वारा 6 मैचों में बनाए गए रनों को दर्शाता है | In the given pie-chart, what is the increase or decrease in score in match 4 as compared to match 2? / इस पाई चार्ट में मैच 2 की तुलना में मैच 4 के स्कोर में कितनी वृद्धि या कमी हुई है ?

The given pie-chart favourite sport of students of a school. दिया गया पाई चार्ट एक विद्यालय के छात्रों के पसंदीदा खेल को दर्शाता है | In the given pie-chart, if there were 1280 students in all, how many liked football? इस पाई चार्ट के अनुसार, यदि कुल मिलाकर 1280 छात्र हैं, तो फुटबॉल कितने छात्रों को पसंद है ?

The given pie chart shows runs scored by A in 6 matches. दिया गया पाई चार्ट A के द्वारा 6 मैचों में बनाए गए रनों को दर्शाता है | In the given pie-chart, if A scored a century in matches 4 and 6, what would have been her average score? / इस पाई चार्ट में यदि A ने चौथे और छठे मैच में शतक लगाया होता तो उसका औसत स्कोर क्या रहता ?

The graph below shows two families. monthly expenditure (in hundreds) नीचे दिया गया ग्राफ दो परिवारों के मासिक व्यय (सेकेंड में) को दर्शाता है In the given graph, what is the ratio of the difference between food and education for families J and K ? दिए गए ग्राफ में, परिवार J और K के लिए भोजन तथा शिक्षा के बीच के व्यय में अंतर का अनुपात क्या है ?

The given pie chart depicts the expenditure incurred in crores towards each sport. In the given pie chart what is the difference between the expenditure incurred on cricket on football

The given pie-chart favourite sport of students of a school. दिया गया पाई चार्ट एक विद्यालय के छात्रों के पसंदीदा खेल को दर्शाता है | In the given pie-chart, if the school strength was 2500, how many liked cricket more than hockey? इस पाई चार्ट के अनुसार, यदि विद्यालय में कुल 2500 छात्र थे , तो कितने छात्र क्रिकेट को हॉकी से ज्यादा पसंद करते थे ?

What is the difference between mean and median of the given data. दिए गए आंकड़ों के माध्य एवं मध्यिका में क्या अंतर है ? 4,6, 3, 7,10, 13, 16 and 5 ?

The table shows Income and expenditure of a person for 3 years (in thousands) यह तालिका 3 वर्षों के दौरान किसी व्यक्ति के आय एवं व्यय (हज़ार में ) को दर्शाती है | In the given table, what is the percentage of expenditure on income in the year 2002? (round off) दी गयी तालिका के अनुसार, वर्ष 2002 में आय पर व्यय का प्रतिशत कया है?

The given bar graph shows the number of marks scored by a student in each subject in three years. दिया गया दंड आरेख एक छात्र के द्वारा तीन वर्षो में प्रत्येक विषय में लाये गए अंकों को दर्शाता है | In the given chart, what is the percentage increase in marks in Mathematics in 2012 compared to 2008 (round off) ? / इस आरेख में वर्ष 2008 की तुलना में वर्ष 2012 में गणित के अंकों में कितने प्रतिशत की वृद्धि हुई है ?

PINNACLE-DATA INTERPRETATION-EXERCISE
  1. The given bar chart shows the sales of books in four metro branches of...

    Text Solution

    |

  2. The given bar graph shows the sale of books (in thousands) in four met...

    Text Solution

    |

  3. The given pie chart shows the expenditure given in millions on each ga...

    Text Solution

    |

  4. The line graph shows the monthly expenditure by two families in hundre...

    Text Solution

    |

  5. The graph below shows two families. monthly expenditure (in hundreds) ...

    Text Solution

    |

  6. The given pie chart depicts the expenditure incurred in crores towards...

    Text Solution

    |

  7. The line graph shows the monthly expenditure by two families in hundre...

    Text Solution

    |

  8. The given bar chart shows the sales of books in four metro branches of...

    Text Solution

    |

  9. The given pie chart depicts the expenditure incured in crores towards ...

    Text Solution

    |

  10. The given bar chart shows population of 4 different states in 3 years ...

    Text Solution

    |

  11. The given bar chart shows population of 4 different states in 3 years ...

    Text Solution

    |

  12. The given pie chart shows the taxable income for A B C and D in lakhs ...

    Text Solution

    |

  13. The line graph shows the temperature on four Sundays of three cities ...

    Text Solution

    |

  14. The line graph shows the temperature on four Sundays of three cities ...

    Text Solution

    |

  15. The line graph shows the temperature on four Sunday of three cities ...

    Text Solution

    |

  16. The given pie chart shows the taxable income for A,B , C and D in lakh...

    Text Solution

    |

  17. The given bar chard shows population of 4 different states in 3 years ...

    Text Solution

    |

  18. The given pie chart shows the taxable income for A , B , C and D in la...

    Text Solution

    |

  19. The table given below presents the number of books on different subjec...

    Text Solution

    |

  20. The table given below presents the number of books on different subjec...

    Text Solution

    |