Home
Class 14
MATHS
The given pie chart shows the taxable in...

The given pie chart shows the taxable income for A,B , C and D in lakhs of rupees

This chart shows the tax paid for the above taxable income by A, B , C and D in lakhs of rupees

In the given pie chart what is overall tax percentage for all four?

A

0.172

B

0.213

C

0.15

D

0.195

Text Solution

Verified by Experts

Promotional Banner

Topper's Solved these Questions

Similar Questions

Explore conceptually related problems

The given pie-chart shows the taxable income for A, B, C and D in lakhs of rupees. This chart shows the tax paid for the above taxable income by A, B, C and D in lakhs of rupees. In the given pie-chart. what is the overall tax percentage for all four?

The given pie chart shows the taxable income for A , B , C and D in lakhs of rupees This chart shows the tax paid for the above taxable income by A, B , C and D in lakhs of rupees IN the given pie chart what is the percentage of tax charged of A

The given pie-chart shows the taxable income for A, B, C and D in lakhs of rupees. This chart shows the tax paid for the above taxable income by A, B, C and D in lakhs of rupees. In the given pie-chart, what is the percentage of tax charged for A?

The given pie-chart shows the taxable income for A, B, C and D in lakhs of rupees. This chart shows the tax paid for the above taxable income by A, B, C and D in lakhs of rupees. In the given pie-chart, what is the percentage of tax charged for A?

The given pie chart shows the taxable income for A B C and D in lakhs of rupees. This chart shows the tax paid for the above taxable income by A , B C and D in lakhs of rupees In the given pie chart if B taxable was 12% more how much tax would he have paid then

The given pie chart shows runs scored by A in 6 matches In the given pie chart what is the average runs scored in all matches

Identify A,B,C and D in given flow chart:-

The given pie chart shows favorite shows of student of a school In the given pie chart, what is the difference in percentage between liking for football and basketball

The given bar chart shows production of steel by companies A , B , C and D for years 2014 ,2015, 2016 In the given pie chart,what is the percentage production of B in 2014 to the total production of 2014.

The given pie-chart shows favourite sport of students of a school. In the given pie-chart, what is the difference in percentage between liking for football and basketball?

PINNACLE-DATA INTERPRETATION-EXERCISE
  1. The line graph shows the temperature on four Sundays of three cities ...

    Text Solution

    |

  2. The line graph shows the temperature on four Sunday of three cities ...

    Text Solution

    |

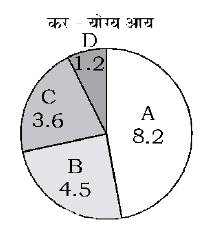
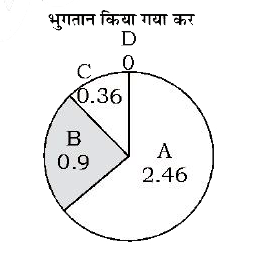
  3. The given pie chart shows the taxable income for A,B , C and D in lakh...

    Text Solution

    |

  4. The given bar chard shows population of 4 different states in 3 years ...

    Text Solution

    |

  5. The given pie chart shows the taxable income for A , B , C and D in la...

    Text Solution

    |

  6. The table given below presents the number of books on different subjec...

    Text Solution

    |

  7. The table given below presents the number of books on different subjec...

    Text Solution

    |

  8. The table given below presents the number of books on different subjec...

    Text Solution

    |

  9. The pie-chart given below shows the number of laptops in an office pro...

    Text Solution

    |

  10. The pie-chart given below shows the number of laptops in an office pro...

    Text Solution

    |

  11. The pie-chart given below shows the number of laptops in an office pro...

    Text Solution

    |

  12. The bar graph given below presents the marks (out of 100) obtained by ...

    Text Solution

    |

  13. The bar graph given below presents the marks (out of 100) obtained by ...

    Text Solution

    |

  14. The bar graph given below presents the marks (out of 100) obtained by ...

    Text Solution

    |

  15. The Table given below presents the marks obtained by three students in...

    Text Solution

    |

  16. The Table given below presents the marks obtained by three students in...

    Text Solution

    |

  17. The Table given below presents the marks obtained by three students in...

    Text Solution

    |

  18. The bar graph given below shows the maximum temperature (^@C) of a cit...

    Text Solution

    |

  19. The bar graph given below shows the maximum temperature (^@C) of a cit...

    Text Solution

    |

  20. The bar graph given below shows the maximum temperature (^@C) of a cit...

    Text Solution

    |