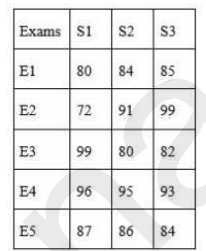
 What is the sum of marks obtained by S1 in Exam E4, S2 in Exam E1, S3 in Exam E3 and E5?
 A
B
C
D
Text Solution
Verified by Experts


PINNACLE-DATA INTERPRETATION-EXERCISE
- The Table given below presents the marks obtained by three students in...
Text Solution
|
- The Table given below presents the marks obtained by three students in...
Text Solution
|
- The Table given below presents the marks obtained by three students in...
Text Solution
|
- The bar graph given below shows the maximum temperature (^@C) of a cit...
Text Solution
|
- The bar graph given below shows the maximum temperature (^@C) of a cit...
Text Solution
|
- The bar graph given below shows the maximum temperature (^@C) of a cit...
Text Solution
|
- The bar graph given below shows the number of cars parked in a parking...
Text Solution
|
- The bar graph given below shows the number of cars parked in a parking...
Text Solution
|
- The bar graph given below shows the number of cars parked in a parking...
Text Solution
|
- The bar graph given below shows the number of men and women working in...
Text Solution
|
- The bar graph given below shows the number of men and women working in...
Text Solution
|
- The bar graph given below shows the number of men and women working in...
Text Solution
|
- The pie chart given below presents the percentage of the number of mot...
Text Solution
|
- The pie chart given below presents the percentage of the number of mot...
Text Solution
|
- The pie chart given below presents the percentage of the number of mot...
Text Solution
|
- The Bar graph below presents the amount (volume in litres) of water in...
Text Solution
|
- The Bar graph below presents the amount (volume in litres) of water in...
Text Solution
|
- The Bar graph given below presents the amount (volume in litres) of wa...
Text Solution
|
- The Bar graph shown below presents the number of employees in an offic...
Text Solution
|
- The Bar graph shown below presents the number of employees in an offic...
Text Solution
|