Home
Class 14
MATHS
The bar graph given below shows the maxi...

The bar graph given below shows the maximum temperature (`^@C`) of a city for ten days in different months.
नीचे दिया गया दण्ड आरेख किसी शहर के विभिन्न मासों में 10 भिन्न दिनों के अधिकतम तापमान (`^@C`) को दर्शाता है |
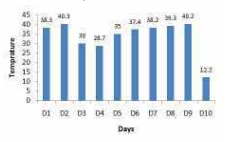
The temperature of D5 is what percent more than the temperature of D3 ?
D5 का तापमान, D3 के तापमान से कितने प्रतिशत अधिक है ?

A

0.2301

B

0.2107

C

0.2457

D

0.1667

Text Solution

Verified by Experts

Promotional Banner

Topper's Solved these Questions

Similar Questions

Explore conceptually related problems

The bar graph given below shows the maximum temperature ( ^@C ) of a city for ten days in different months. नीचे दिया गया दण्ड आरेख किसी शहर के विभिन्न मासों में 10 भिन्न दिनों के अधिकतम तापमान ( ^@C ) को दर्शाता है | What is the average per day maximum temperature of the city for the given period of ten days ? दिए गए दस दिनों के लिए प्रतिदिन शहर का औसत अधिकतम तापमान कितना है ?

The bar graph given below shows the maximum temperature ( ^@C ) of a city for ten days in different months. नीचे दिया गया दण्ड आरेख किसी शहर के विभिन्न मासों में 10 भिन्न दिनों के अधिकतम तापमान ( ^@C ) को दर्शाता है | From the from the given data of ten days, Find the difference ( in degrees Celsius ) between the highest and the lowest temperatures recorded ? दस दिनों के लिए दिए गए डाटा से रिकॉर्ड किए गए उच्चतम और न्यूनतम अधिकतम तापमानों के बीच कितना अंतर (डिग्री सेल्सियस में) है ?

The bar graph given below presents the marks (out of 100) obtained by 10 students in a subject. यह दंड आरेख एक विषय में 10 छात्रों के प्राप्तांक ( 100 में से ) को दर्शाता है | The average of marks obtained by S3 and S5 is what percent less than the marks obtained by S9? S3 और S5 के प्राप्तांक का औसत S9 के प्राप्तांक से कितना प्रतिशत कम है ?

The bar graph given below presents the marks (out of 100) obtained by 10 students in a subject. यह दंड आरेख एक विषय में 10 छात्रों के प्राप्तांक ( 100 में से ) को दर्शाता है | The marks obtained by S5 is how much percent more than the average marks of the students (correct to two decimal)? S5 का प्राप्तांक छात्रों के औसत अंक से कितना प्रतिशत अधिक है ?

The bar graph given below shows the number of cars parked in a parking area during ten different days . नीचे दिया गया दंड आरेख किसी पार्किंग क्षेत्र में दस अलग-अलग दिनों में खड़ी कारों की संख्या को दर्शाता है What is the difference between the numbers of cars parked in D3 and D8 ? D3 तथा D8 में खड़ी कारों की संख्या का अंतर कितना है ?

The bar graph given below shows the number of men and women working in the five different companies. नीचे दिया गया दंड आरेख पाँच विभिन्न कंपनियों में कार्य करने वाले पुरुषों तथा महिलाओं की संख्या को दर्शाता है | The total number of men working in the five companies is approximately what percent more than that of women working in these companies? इन पांच कंपनियों में कार्य करने वाले पुरुषों की कुल संख्या, इन पांच कंपनियों में कार्य करने वाली महिलाओं की कुल संख्या से (लगभग) कितना प्रतिशत अधिक है ?

The Bar graph given below presents the number of shoes manufactured by a company on the different days of a week. नीचे दिया गया दंड आरेख एक कंपनी के द्वारा सप्ताह के अलग-अलग दिनों को बनाए गए जूतों की संख्या प्रस्तुत करता है | The number of shoes manufactured on D1 is what percentage of shoes manufactured on D7? D1 को बनाए गए जूतों की संख्या D7 को बनाए गए जूतों की संख्या का कितना प्रतिशत है ?

The bar graph given below presents the number of books sold by a bookseller during different months of a year. नीचे दिया गया दंड आरेख एक पुस्तक विक्रेता के द्वारा किसी वर्ष के अलग-अलग महीनों में बेची गयी पुस्तकों की संख्या को दर्शाता है | The number of books sold in month M3 is what percent of books sold in month M6? माह M3 में बेची गयी पुस्तकों की संख्या माह M6 में बेची गयी पुस्तकों की संख्या का कितना प्रतिशत है ?

The Bar graph given below presents the number of shoes manufactured by a company on the different days of a week. नीचे दिया गया दंड आरेख एक कंपनी के द्वारा सप्ताह के अलग-अलग दिनों को बनाए गए जूतों की संख्या प्रस्तुत करता है | The number of shoes manufactured on D5 is how much more than the average number of shoes manufactured per day? D5 को बनाए गए जूतों की संख्या प्रतिदिन बनाए गए जूतों की औसत संख्या से कितनी अधिक है ?

The bar graph given below presents the number of books sold by a bookseller during different months of a year. नीचे दिया गया दंड आरेख एक पुस्तक विक्रेता के द्वारा किसी वर्ष के अलग-अलग महीनों में बेची गयी पुस्तकों की संख्या को दर्शाता है | The number of books sold in month M8 is how much more than the average number of books sold per month? माह M8 में बेची गयी पुस्तकों की संख्या प्रति माह बेची गयी पुस्तकों की औसत संख्या से कितना प्रतिशत अधिक है ?

PINNACLE-DATA INTERPRETATION-EXERCISE
  1. The Table given below presents the marks obtained by three students in...

    Text Solution

    |

  2. The bar graph given below shows the maximum temperature (^@C) of a cit...

    Text Solution

    |

  3. The bar graph given below shows the maximum temperature (^@C) of a cit...

    Text Solution

    |

  4. The bar graph given below shows the maximum temperature (^@C) of a cit...

    Text Solution

    |

  5. The bar graph given below shows the number of cars parked in a parking...

    Text Solution

    |

  6. The bar graph given below shows the number of cars parked in a parking...

    Text Solution

    |

  7. The bar graph given below shows the number of cars parked in a parking...

    Text Solution

    |

  8. The bar graph given below shows the number of men and women working in...

    Text Solution

    |

  9. The bar graph given below shows the number of men and women working in...

    Text Solution

    |

  10. The bar graph given below shows the number of men and women working in...

    Text Solution

    |

  11. The pie chart given below presents the percentage of the number of mot...

    Text Solution

    |

  12. The pie chart given below presents the percentage of the number of mot...

    Text Solution

    |

  13. The pie chart given below presents the percentage of the number of mot...

    Text Solution

    |

  14. The Bar graph below presents the amount (volume in litres) of water in...

    Text Solution

    |

  15. The Bar graph below presents the amount (volume in litres) of water in...

    Text Solution

    |

  16. The Bar graph given below presents the amount (volume in litres) of wa...

    Text Solution

    |

  17. The Bar graph shown below presents the number of employees in an offic...

    Text Solution

    |

  18. The Bar graph shown below presents the number of employees in an offic...

    Text Solution

    |

  19. The Bar graph shown below presents the number of employees in an offic...

    Text Solution

    |

  20. The Table given below presents the Rainfall (in mm) in two cities on d...

    Text Solution

    |