Home
Class 14
MATHS
The bar graph given below shows the numb...

The bar graph given below shows the number of cars parked in a parking area during ten different days. What is the total number of cars parked in the parking area for all 10 days ?

नीचे दिया गया दंड आरेख किसी पार्किंग क्षेत्र में दस अलग-अलग दिनों में खड़ी कारों की संख्या को दर्शाता है
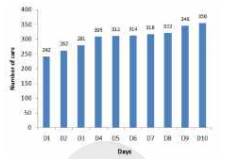
पार्किंग क्षेत्र में सभी 10 दिनों में खड़ी कारों की कुल संख्या कितनी है ?

A

3882

B

3462

C

3062

D

3862

Text Solution

Verified by Experts

Promotional Banner

Topper's Solved these Questions

Similar Questions

Explore conceptually related problems

The Bar graph given below presents the number of cars parked on ten different days in a parking area What is the total number of cars parked on all the ten days in the parking area ?

The Bar graph given below presentes the number of cars parked on ten different days in a parking area. What is the difference in the number of cars parked on D3 and D8 ?

The bar graph given below shows the number of cars parked in a parking area during ten different days . नीचे दिया गया दंड आरेख किसी पार्किंग क्षेत्र में दस अलग-अलग दिनों में खड़ी कारों की संख्या को दर्शाता है What is the difference between the numbers of cars parked in D3 and D8 ? D3 तथा D8 में खड़ी कारों की संख्या का अंतर कितना है ?

The Bar graph given below presents the number of cars parked on ten different days in a parking area Number of cars parked on D10 how much percentage (correct up to two decimal places) more the number of cars parked on DI ?

The bar graph given below presents the number of books sold by a bookseller during different months of a year. नीचे दिया गया दंड आरेख एक पुस्तक विक्रेता के द्वारा किसी वर्ष के अलग-अलग महीनों में बेची गयी पुस्तकों की संख्या को दर्शाता है | The number of books sold in month M3 is what percent of books sold in month M6? माह M3 में बेची गयी पुस्तकों की संख्या माह M6 में बेची गयी पुस्तकों की संख्या का कितना प्रतिशत है ?

The pie-chart given below shows the number of laptops in an office provided by six different companies in the percentage of total number of laptops. The central angles given in the pie chart are not accurate to any scale. नीचे दिया गया वृत्त-आरेख, छह अलग-अलग कम्पनियों द्वारा किसी कार्यालय में प्रदत्त लैपटॉप की संख्या को, लेपटॉपों की कुल संख्या के प्रतिशत के रूप में दर्शाता है | वृत्त-आरेख में प्रदर्शित केंद्रीय कोण किसी चयनित पैमाने के अनुसार नहीं है | If the total number of laptops in office is 3800, then find the difference between the laptops of company C2 and C5 ? कार्यालय में यदि लैपटॉपों की कुल संख्या 3800 है तो कंपनी C2 तथा C5 के लैपटॉपों की संख्या में अंतर कितना है ?

The pie-chart given below shows the number of laptops in an office provided by six different companies in the percentage of total number of laptops. The central angles given in the pie chart are not accurate to any scale. नीचे दिया गया वृत्त-आरेख, छह अलग-अलग कम्पनियों द्वारा किसी कार्यालय में प्रदत्त लैपटॉप की संख्या को, लेपटॉपों की कुल संख्या के प्रतिशत के रूप में दर्शाता है | वृत्त-आरेख में प्रदर्शित केंद्रीय कोण किसी चयनित पैमाने के अनुसार नहीं है | What is the ratio of the number of laptops of company C1 to those of company C3 ? कंपनी C1 तथा कंपनी C3 के लेपटॉपों की संख्या का अनुपात कितना है ?

The Bar graph shown below presents the number of employees in an office during eight consecutive years. नीचे दिया गया दंड आरेख किसी कार्यालय में आठ लगातार वर्षों के दौरान कर्मचारियों की संख्या को दर्शाता है | What is the average number of employees per year? प्रति वर्ष कर्मचारियों की औसत संख्या कितनी है ?

The pie-chart given below shows the number of laptops in an office provided by six different companies in the percentage of total number of laptops. The central angles given in the pie chart are not accurate to any scale. नीचे दिया गया वृत्त-आरेख, छह अलग-अलग कम्पनियों द्वारा किसी कार्यालय में प्रदत्त लैपटॉप की संख्या को, लेपटॉपों की कुल संख्या के प्रतिशत के रूप में दर्शाता है | वृत्त-आरेख में प्रदर्शित केंद्रीय कोण किसी चयनित पैमाने के अनुसार नहीं है | To what degree is the corresponding central angle (to one decimal place) of laptops provided by company C6? कंपनी C6 द्वारा प्रदत्त लैपटॉपों का संगत केन्द्रीय कोण (दशमलव के एक स्थान तक) कितनी डिग्री का है ?

The pie chart given below presents the percentage of the number of motor cycles of different colours out of the total number of motor cycles, parked in an area. The central angles shown in the Pie chart are not as per any chosen scale. नीचे दिया गया वृत्त-आरेख किसी क्षेत्र में खड़ी की गयीं कुल मोटरसाइकिलों में से अलग-अलग रंग की मोटरसाइकिलों की संख्या का प्रतिशत दर्शाता है | इस वृत्त-आरेख में दिए गए केंद्रीय कोण किसी भी चयनित पैमाने के अनुसार नहीं हैं | If the total number of motor cycles parked is 2300, then what is the number of red colour motor cycles out of them? यदि खड़ी की गयी मोटरसाइिकलों की कुल संख्या 2300 है, तो इनमें से लाल रंग की मोटरसाइिकल कितनी है ?

PINNACLE-DATA INTERPRETATION-EXERCISE
  1. The bar graph given below shows the maximum temperature (^@C) of a cit...

    Text Solution

    |

  2. The bar graph given below shows the number of cars parked in a parking...

    Text Solution

    |

  3. The bar graph given below shows the number of cars parked in a parking...

    Text Solution

    |

  4. The bar graph given below shows the number of cars parked in a parking...

    Text Solution

    |

  5. The bar graph given below shows the number of men and women working in...

    Text Solution

    |

  6. The bar graph given below shows the number of men and women working in...

    Text Solution

    |

  7. The bar graph given below shows the number of men and women working in...

    Text Solution

    |

  8. The pie chart given below presents the percentage of the number of mot...

    Text Solution

    |

  9. The pie chart given below presents the percentage of the number of mot...

    Text Solution

    |

  10. The pie chart given below presents the percentage of the number of mot...

    Text Solution

    |

  11. The Bar graph below presents the amount (volume in litres) of water in...

    Text Solution

    |

  12. The Bar graph below presents the amount (volume in litres) of water in...

    Text Solution

    |

  13. The Bar graph given below presents the amount (volume in litres) of wa...

    Text Solution

    |

  14. The Bar graph shown below presents the number of employees in an offic...

    Text Solution

    |

  15. The Bar graph shown below presents the number of employees in an offic...

    Text Solution

    |

  16. The Bar graph shown below presents the number of employees in an offic...

    Text Solution

    |

  17. The Table given below presents the Rainfall (in mm) in two cities on d...

    Text Solution

    |

  18. The Table given below presents the Rainfall (in mm) in two cities on d...

    Text Solution

    |

  19. The Table given below presents the Rainfall (in mm) in two cities on d...

    Text Solution

    |

  20. The bar graph given below presents the number of books sold by a books...

    Text Solution

    |