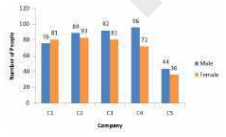
 What is the ratio of the total number of men working the companies C2 and C3 to the total number of women working in the companies C1 and C5 ?
 A
B
C
D
Text Solution
Verified by Experts


PINNACLE-DATA INTERPRETATION-EXERCISE
- The bar graph given below shows the number of cars parked in a parking...
Text Solution
|
- The bar graph given below shows the number of cars parked in a parking...
Text Solution
|
- The bar graph given below shows the number of men and women working in...
Text Solution
|
- The bar graph given below shows the number of men and women working in...
Text Solution
|
- The bar graph given below shows the number of men and women working in...
Text Solution
|
- The pie chart given below presents the percentage of the number of mot...
Text Solution
|
- The pie chart given below presents the percentage of the number of mot...
Text Solution
|
- The pie chart given below presents the percentage of the number of mot...
Text Solution
|
- The Bar graph below presents the amount (volume in litres) of water in...
Text Solution
|
- The Bar graph below presents the amount (volume in litres) of water in...
Text Solution
|
- The Bar graph given below presents the amount (volume in litres) of wa...
Text Solution
|
- The Bar graph shown below presents the number of employees in an offic...
Text Solution
|
- The Bar graph shown below presents the number of employees in an offic...
Text Solution
|
- The Bar graph shown below presents the number of employees in an offic...
Text Solution
|
- The Table given below presents the Rainfall (in mm) in two cities on d...
Text Solution
|
- The Table given below presents the Rainfall (in mm) in two cities on d...
Text Solution
|
- The Table given below presents the Rainfall (in mm) in two cities on d...
Text Solution
|
- The bar graph given below presents the number of books sold by a books...
Text Solution
|
- The bar graph given below presents the number of books sold by a books...
Text Solution
|
- The bar graph given below presents the number of books sold by a books...
Text Solution
|